

Listen to this article
Jump to a section
In this article
Executive Summary
In 2018 DBS stopped running technology as a portfolio of approved projects and reorganised the bank into 33 platforms. Each platform owns a customer service or product along with the people, funding, technology and applications behind it. Each is led by a pair: one leader from the business, one from technology, accountable together for the same results. The pair is funded as a standing unit, measured on a shared scorecard that ties part of their pay to transformation, and reviewed on live dashboards by a council of senior managers. From 2021 DBS added a second layer, Managing through Journeys, so that work crossing several platforms has one cross-functional team behind it. That structure is the base DBS built its AI results on, and the parts that matter most can be copied at a far smaller scale.
33
platforms established in 2018, grouped in four categories, each co-led by business and technology, DBS Annual Report 2018
20%
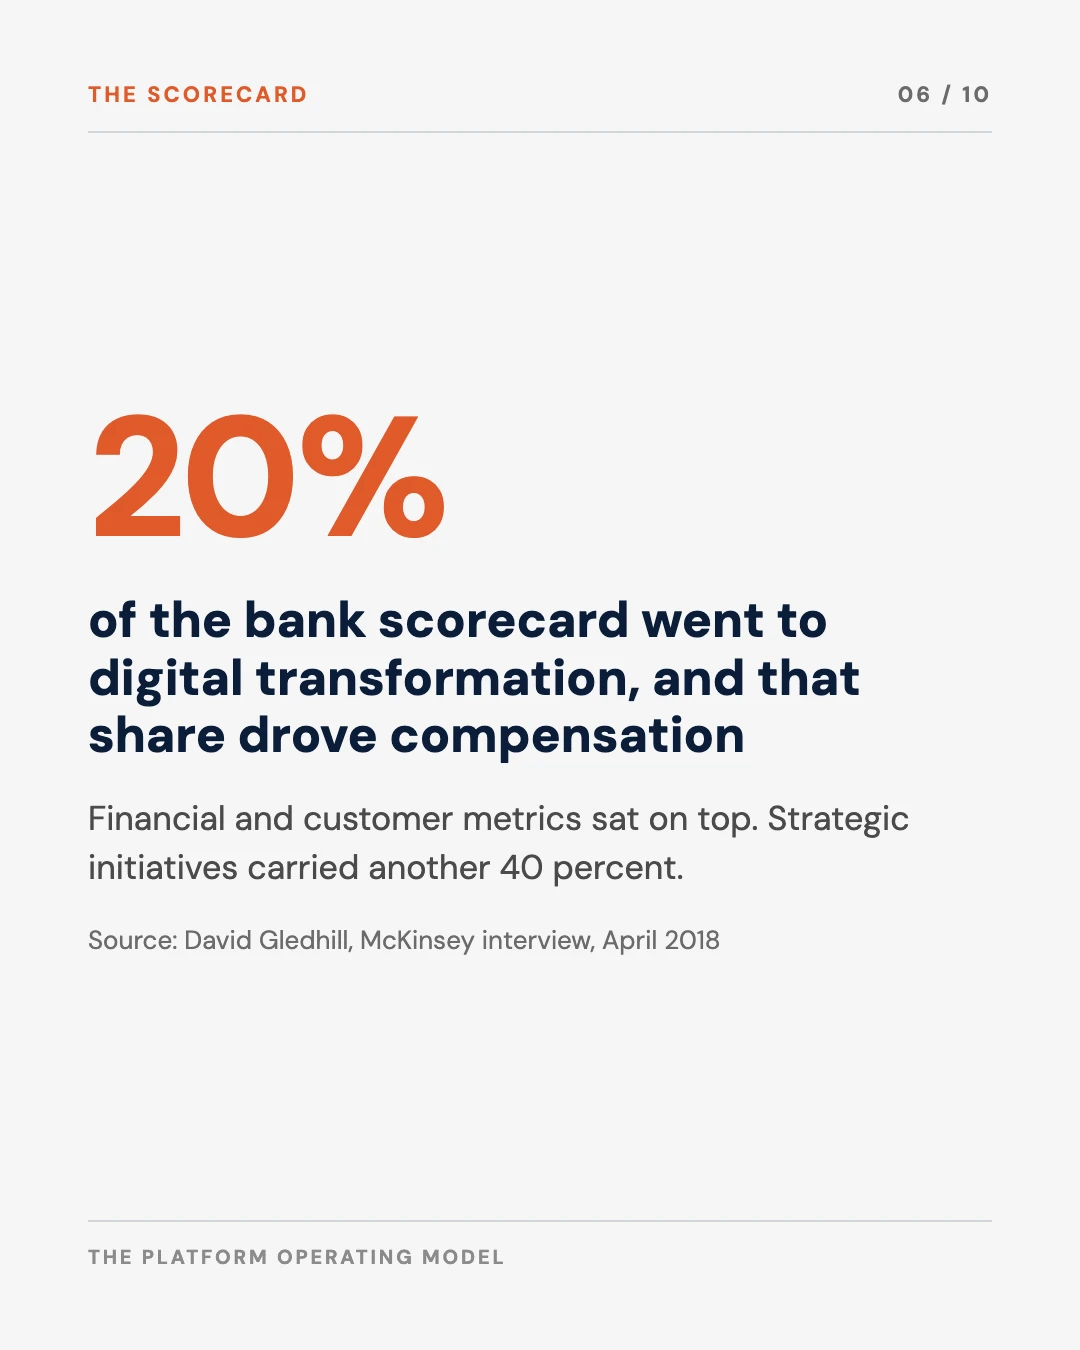
of the bank scorecard weighted to digital transformation and used to drive compensation, David Gledhill to McKinsey, 2018
60+
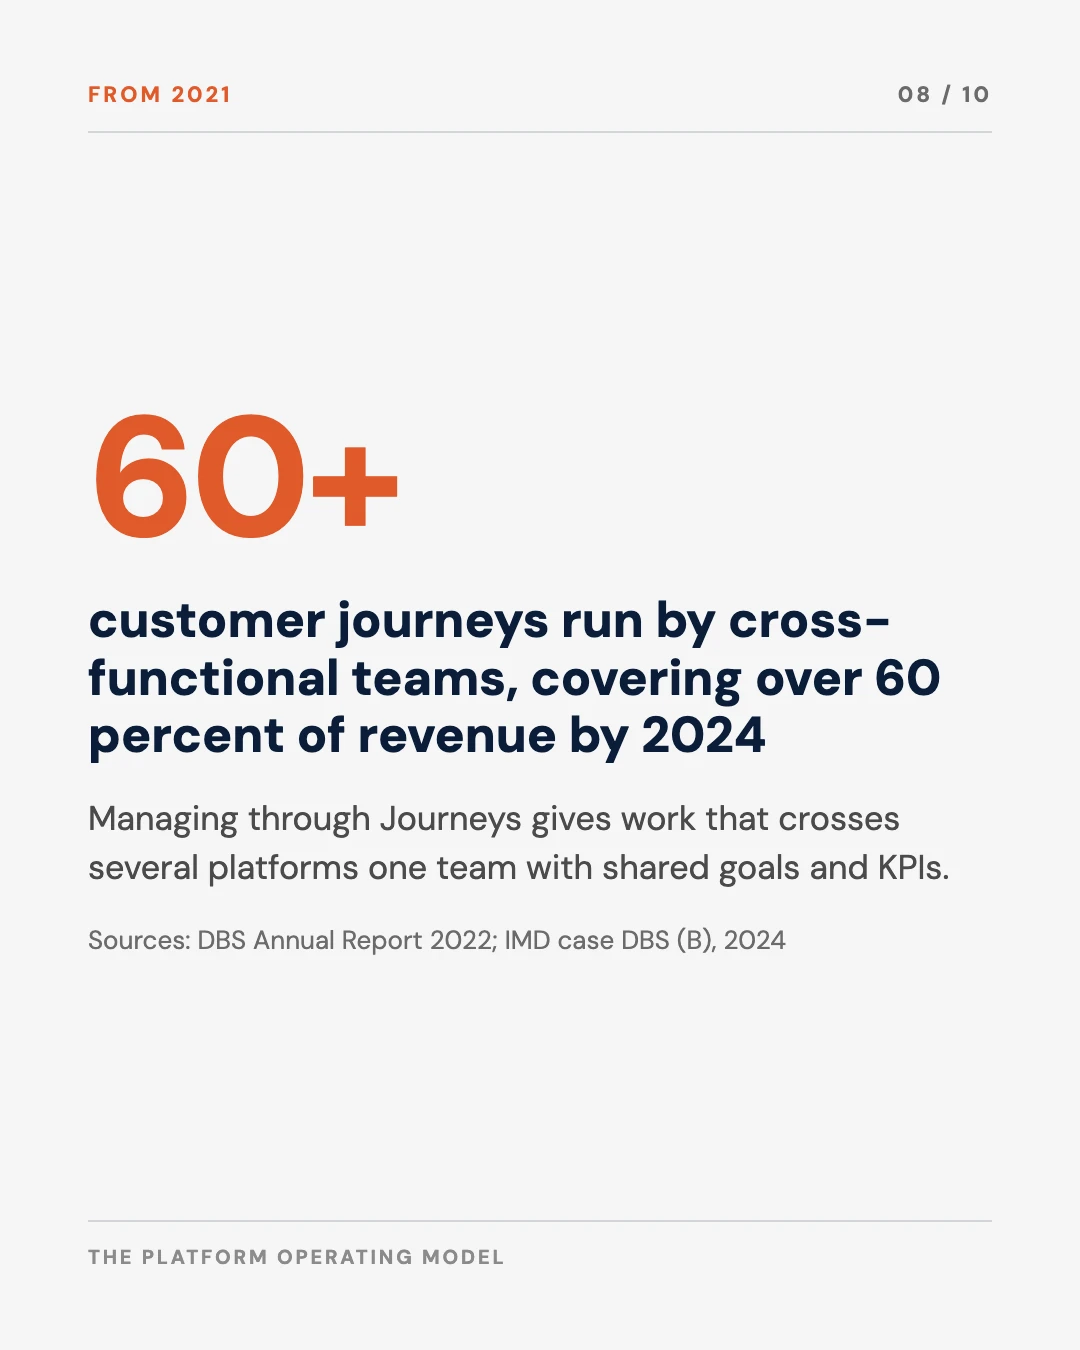
customer journeys run by cross-functional teams by 2024, covering over 60 percent of revenue, IMD case study
64,000
software releases a month in 2022, up from 30,000 in 2019, DBS annual reports
Core conclusions
- The platform model is a decision about ownership and money. A business leader and a technology leader share one set of KPIs, and the platform is funded as a standing unit and judged on outcomes.
- DBS wrote the model into pay before it asked for new behaviour. A fixed share of the scorecard went to transformation, and that share drove compensation.
- Platforms alone fragment the customer. The journey layer DBS added in 2021 gives work that crosses several platforms a single team and a shared goal.
The argument, in ten slides
Save it, or send it to whoever owns your operating model.
What DBS changed in 2018
By 2017 DBS had spent five years fixing its technology basics and three more pushing to become “digital to the core”. Its engineering was mostly back in-house, its applications were moving to a private cloud, and it had opened 155 APIs to outside developers. What it still had was the standard bank arrangement: the business asked for projects, technology delivered them, and every change went through an approval queue. David Gledhill, then Chief Information Officer, described the shift DBS made next as moving “from individual projects that need approvals, subcommittees, and things like that, to giving the freedom to a group of people to operate like a platform.”
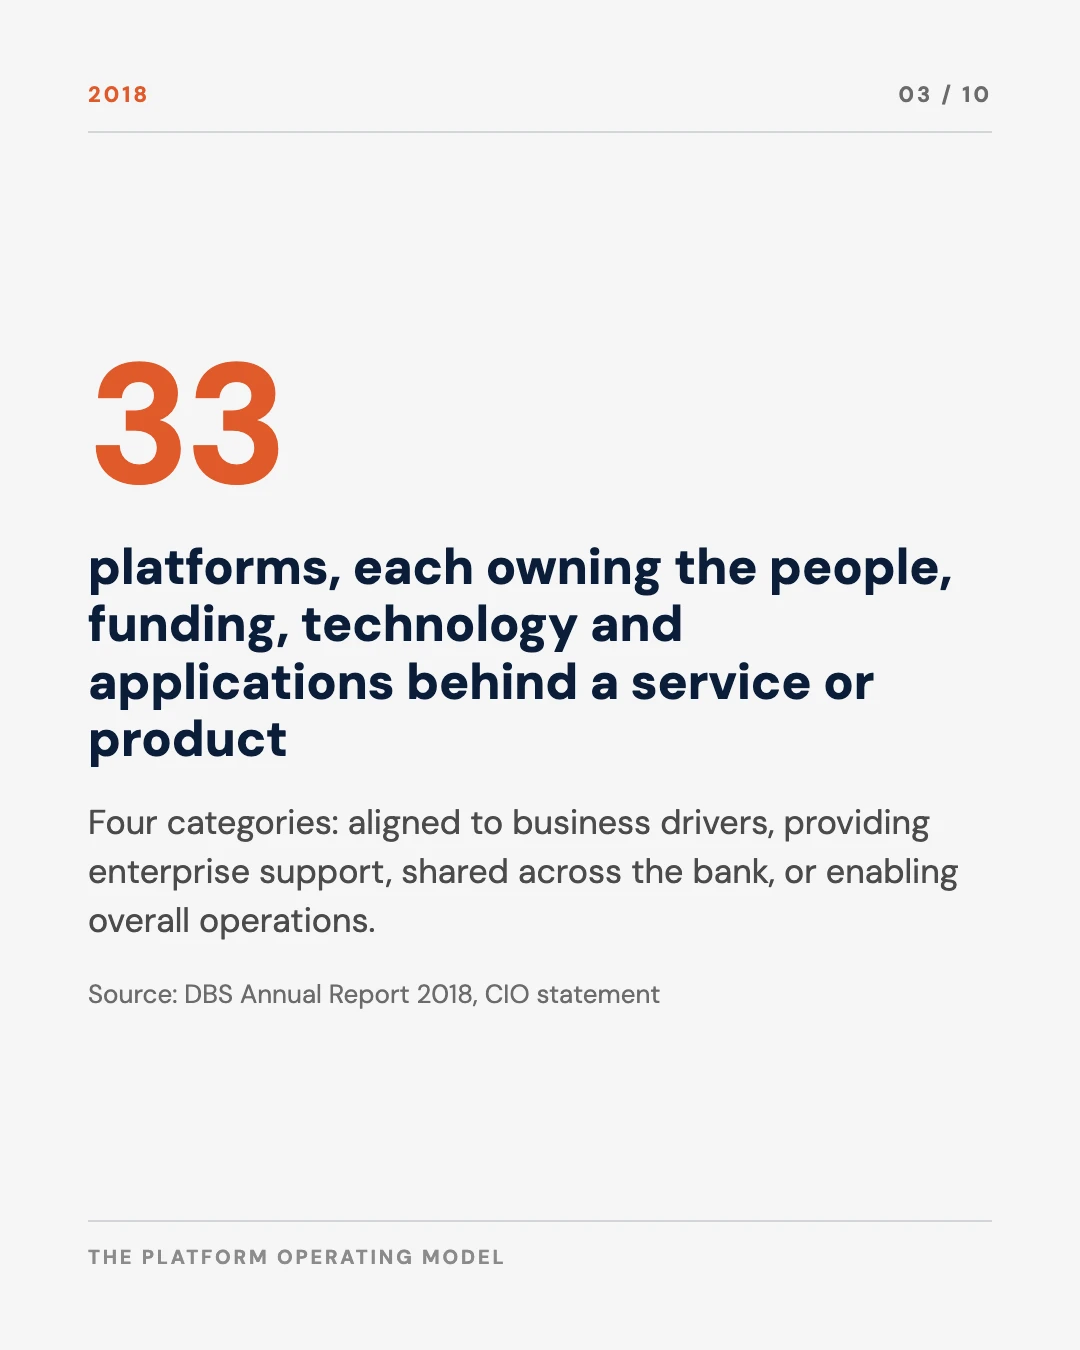
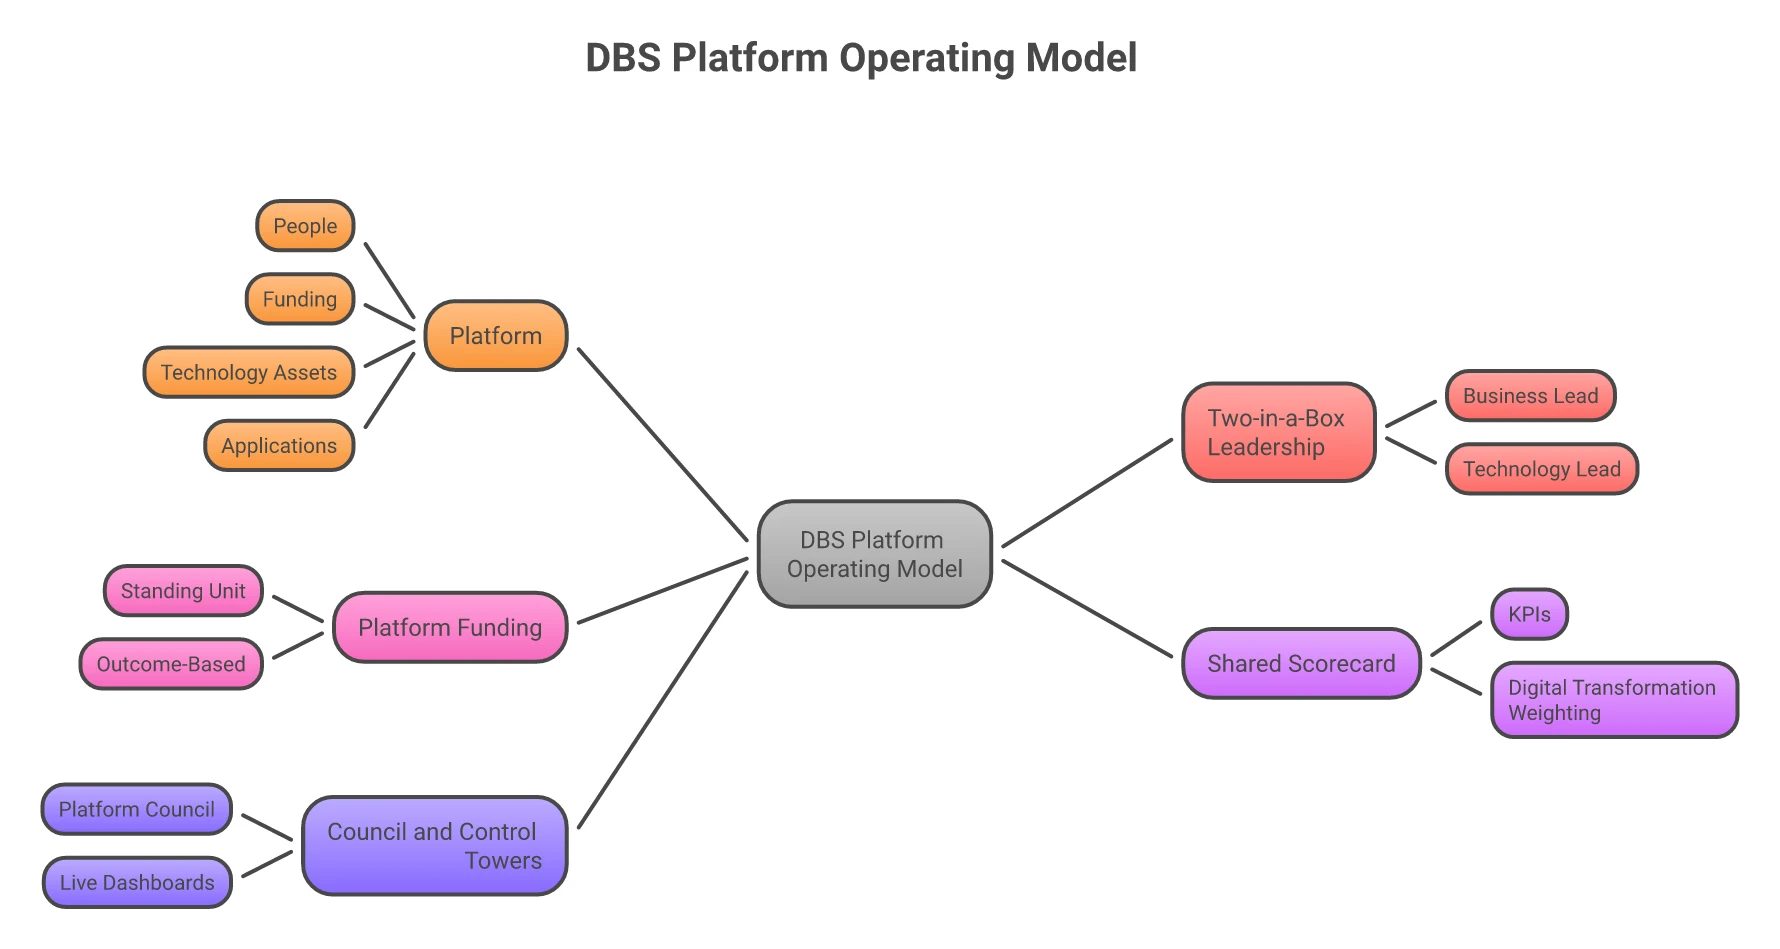
The 2018 annual report set out the new unit. “Platforms bring together people, funding, technology assets and apps to deliver a customer service or product. They are based on a two-in-a-box framework which means that platforms are co-developed and maintained by the business and its technology partners who work together on joint goals, business strategy and an execution roadmap.” Thirty-three platforms were set up that year, in four categories: those aligned to business drivers, those providing enterprise support, those shared across the bank, and those enabling the bank’s overall operations.
The full sequence that led here, from 2009 to the AI results, is set out in the DBS case study.
How the two-in-a-box pair works
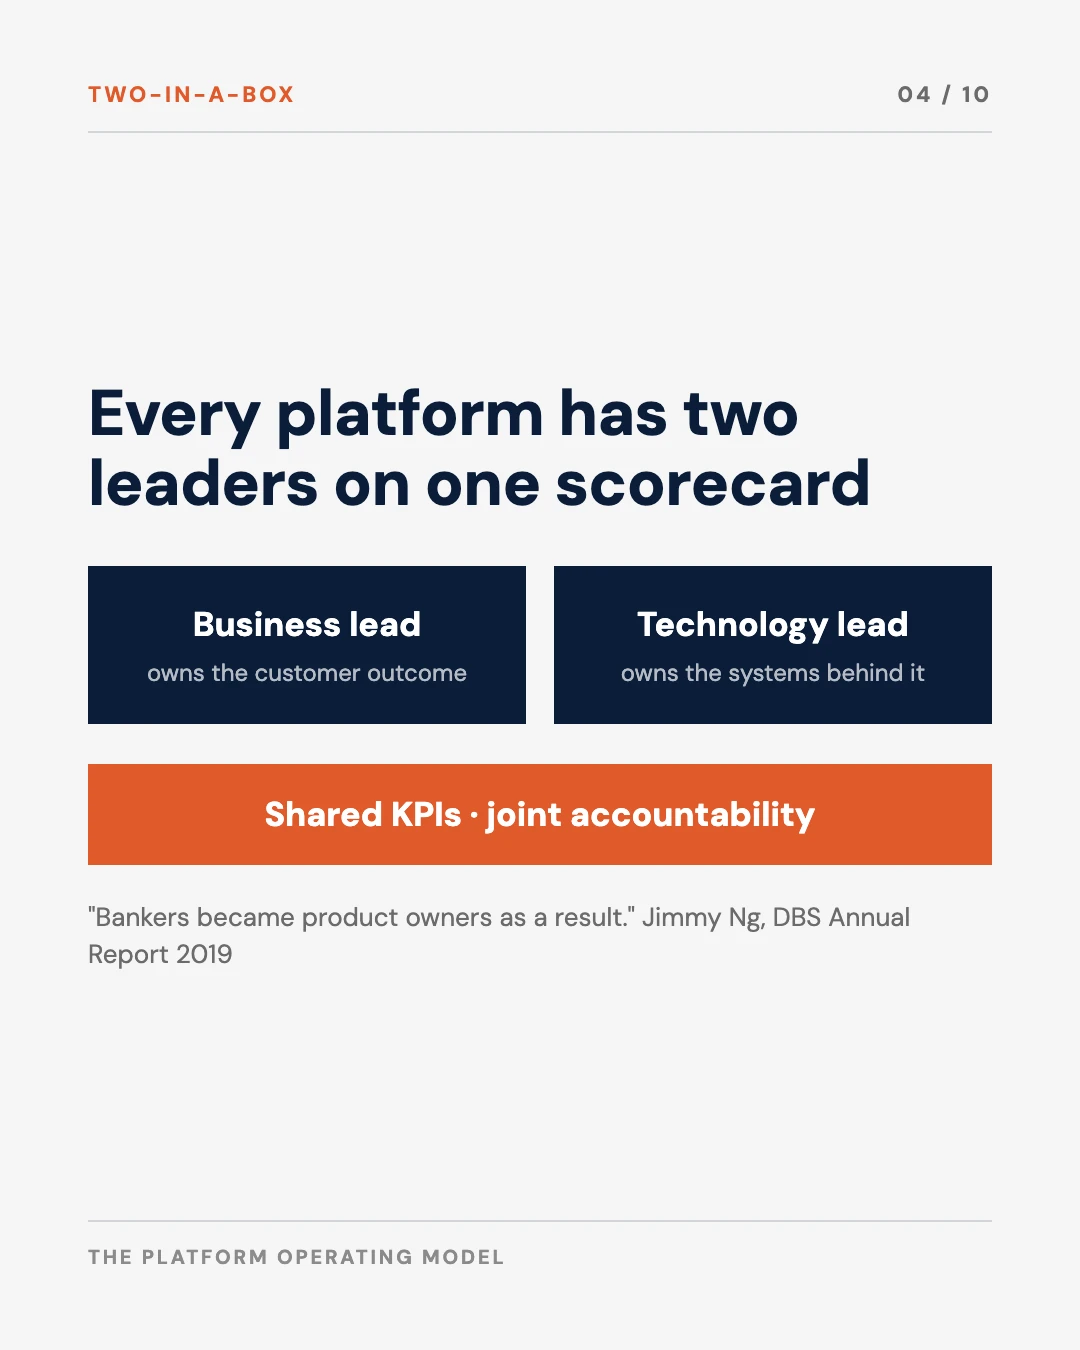
Each platform has two leaders. Piyush Gupta, CEO at the time, put it simply in 2025: each platform “was led jointly by someone from the business and someone from IT. They share KPI outcomes.” MIT’s Center for Information Systems Research, which studied DBS over several years, describes the business and technology leads as holding “joint accountability for a platform’s health and success.”
The effect is on the argument that follows a missed target. In the project model a late or disappointing result is a dispute between the business that specified it and the technology team that built it. With one scorecard and two names on it, there is no second party to point at. Jimmy Ng, who succeeded Gledhill as CIO, recorded the consequence in the 2019 annual report: “Bankers became product owners as a result, with the platform as the engine for transformation.”
Thirty-three platforms, two leaders each, one scorecard.
From 2018, each of 33 platforms has a standing budget and is led by a business lead and a technology lead on one scorecard. A missed target has no second party to blame.
Sources: DBS Annual Report 2018; MIT CISR (2022); Gupta (2025). Positions are schematic.
Funding the platform and scoring the pair
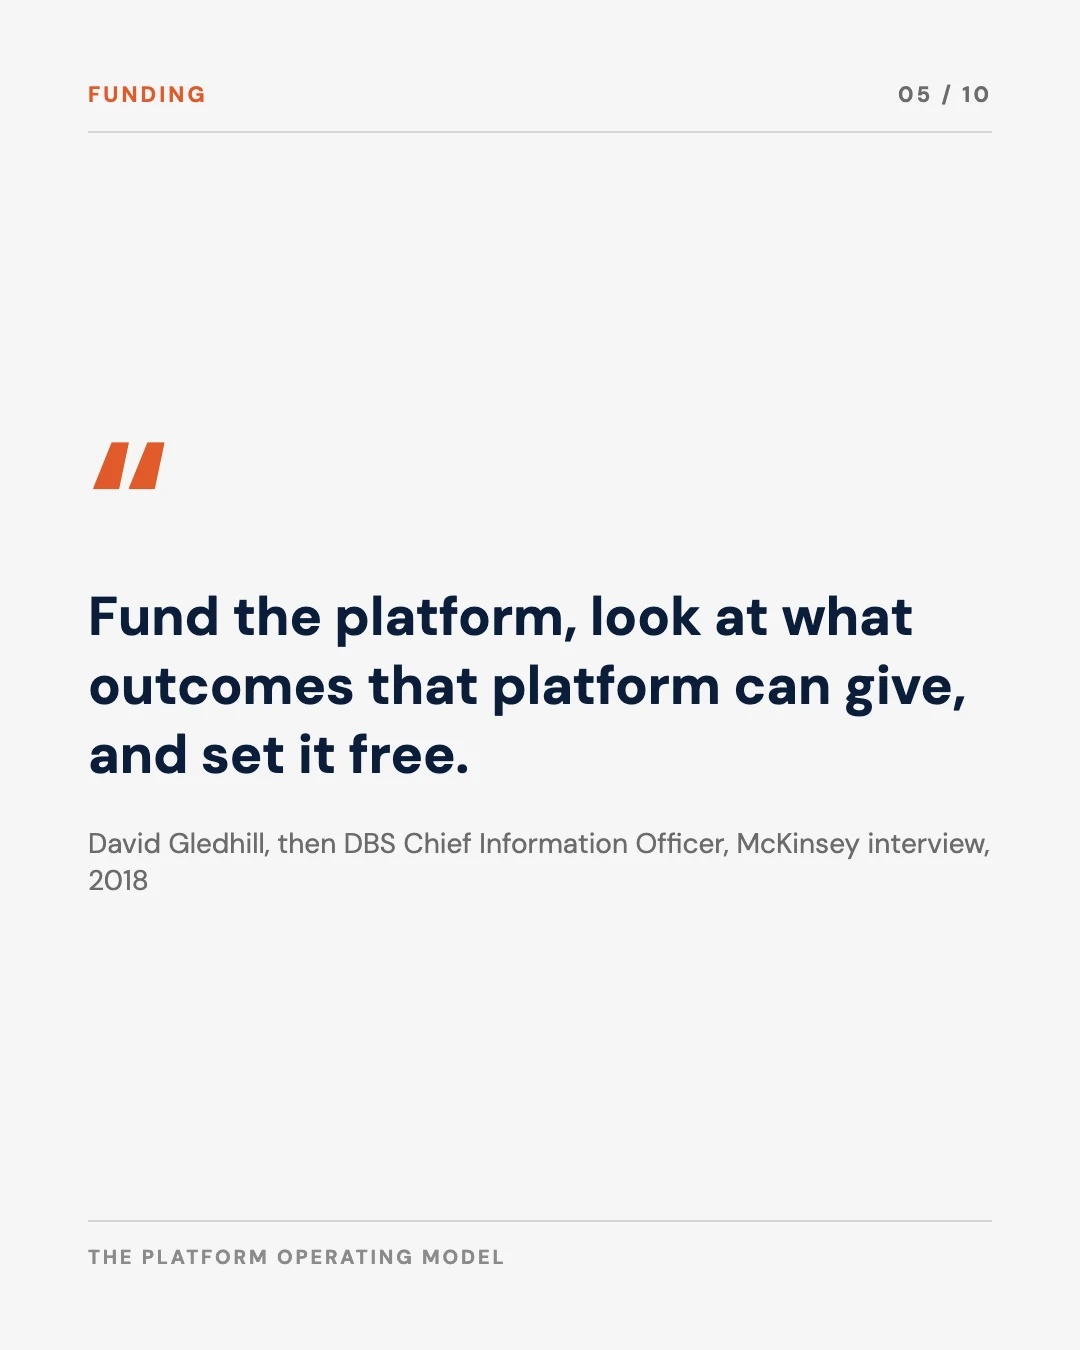
Money follows the platform. Gledhill’s description was to “fund the platform, look at what outcomes that platform can give, and set it free.” A platform does not return to a committee with a business case for each change. It holds a budget, a roadmap and a set of outcomes, and it is judged on the outcomes.
The scorecard is what makes the arrangement stick. Gledhill set out its shape in 2018. The top part is financial and customer metrics, shareholder value-add and revenue. The middle part covers digital transformation, and “we ascribe 20 percent of the value of the scorecard to this, which is then used to drive compensation.” Strategic initiatives carry another 40 percent. His summary: “If you embed that into the KPIs and scorecards that everybody’s measured by… then you get results.”
DBS had used the same lever earlier for culture. In 2015 running an experiment was in every employee’s KPIs, and the bank ran about a thousand. Its top 250 senior managers were each required to sponsor one customer or employee journey. The platform model extended a habit the bank already had: change what people are measured on first.
How the platforms are overseen
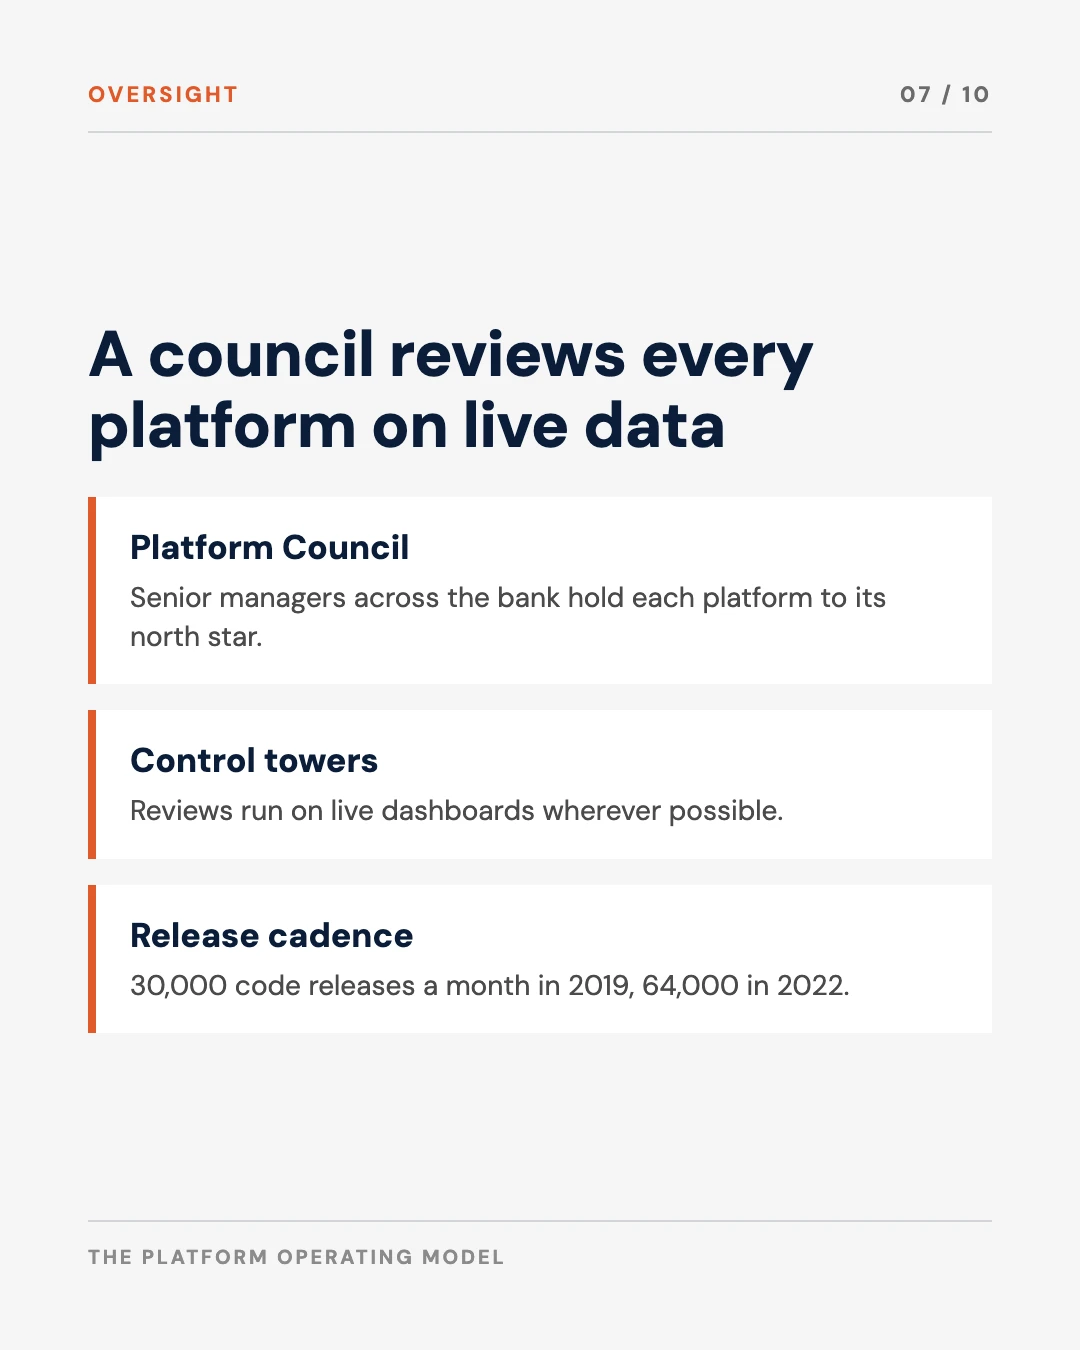
A Platform Council of senior managers from across the bank gives each platform “strategic support and guidance to help platforms achieve their north star”, in the words of the 2018 annual report. Reviews run on live data. Gupta said the bank “mandated that all internal presentations and reviews, as much as possible, be run with control towers and live dashboards.” A council that sees the same live numbers the platform team sees spends its time on decisions.
The table sets out the mechanics as the public record describes them.
| Mechanism | How DBS runs it | Source |
|---|---|---|
| Unit | 33 platforms from 2018, each owning people, funding, technology assets and applications for a service or product | DBS AR2018 |
| Leadership | A business lead and a technology lead, jointly accountable | DBS AR2018; MIT CISR 2022; Gupta 2025 |
| Funding | The platform is funded as a standing unit and judged on its outcomes | Gledhill, McKinsey 2018 |
| Pay | 20% of the scorecard on transformation, driving compensation; 40% on strategic initiatives | Gledhill, McKinsey 2018 |
| Oversight | Platform Council of senior managers; reviews on control towers and live dashboards | DBS AR2018; Gupta 2025 |
| Cross-platform work | Managing through Journeys from 2021, with shared priorities, goals and KPIs | DBS AR2022; IMD 2024 |
AR is the DBS annual report for the year named. Full references are listed at the end of the post.
The journey layer added in 2021
A platform model has a known weakness. A customer’s problem rarely sits inside one platform. Opening an account, applying for a loan or resolving a complaint can touch half a dozen, and each platform optimises its own piece.
DBS answered this from 2021 with Managing through Journeys. The 2022 annual report describes it: “Technology, Business, Operations, and Support Units work together in cross-functional teams and share technology prioritisation, goals and KPIs.” The platforms still own the capabilities. The journey team owns the customer outcome across them. According to IMD’s 2024 case on DBS, pilots began in 2021 and by 2024 more than 60 journeys were running, covering over 60 percent of the bank’s revenue.
The delivery numbers show the model working at scale. DBS reported 30,000 code releases a month in 2019 and 64,000 a month in 2022. A bank that ships that often cannot route each change through a project committee.
The cost DBS paid for the speed
The same period includes a warning. Between November 2021 and October 2023 DBS suffered a series of digital outages, and the Monetary Authority of Singapore raised the bank’s operational-risk capital multiplier to 1.8 times, about S$1.6 billion in additional capital, then imposed a six-month pause on non-essential IT changes. DBS’s own 2023 annual report named the link: the shift from a mainframe to “a cloud-native, microservices-based approach… created a more complex infrastructure requiring additional operational rigour and oversight.” Any organisation copying the platform model should build the resilience and change controls at the same time as the speed.
Adapting the model in a smaller organisation
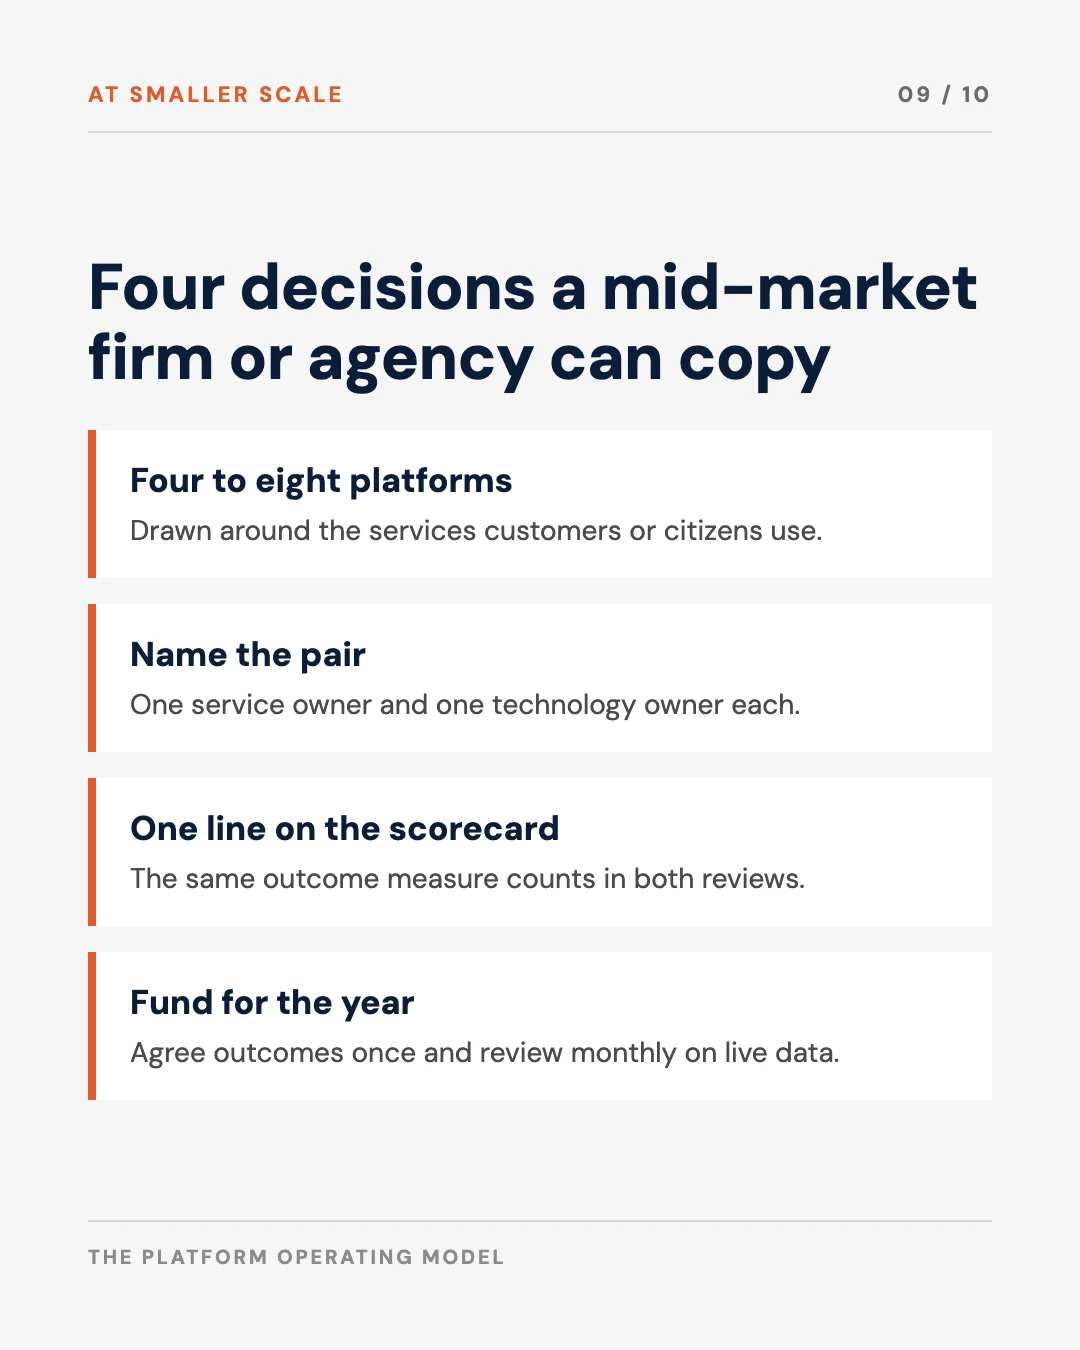
A mid-market enterprise or a public agency does not need 33 platforms. It needs the four decisions underneath them.
Choose four to eight platforms. Draw them around the services customers or citizens use, such as onboarding, payments, licensing or case management, plus one shared data platform. Every system and every technology person belongs to exactly one.
Name the pair. For each platform, one business or service owner and one technology owner. In an agency the business owner is the director who answers for the service, and the technology owner is the person who answers for the systems behind it.
Put the pair on one line of the scorecard. Give both the same outcome measures and let a fixed share of their assessment depend on them. This is the step most organisations skip, and without it the pair reverts to client and supplier within a quarter.
Fund the platform for the year. Agree a budget and a set of outcomes once, review progress monthly on live data, and stop requiring a new business case for each change inside the platform’s remit.
Add journeys only when the platforms are stable and a customer outcome clearly crosses several of them. Start with the one journey that generates the most complaints.
Free tool
How Far Is Your Organisation From DBS?
Score your organisation on the nine capabilities DBS built before its AI paid off, and see which gap to close first.
Evidence & Methodology
The description of the model comes from DBS’s own annual reports and from interviews its leaders gave, with MIT CISR and IMD as the independent accounts. The advice on adapting it is mine. Here is the grading.
| Claim | Source | Grade |
|---|---|---|
| 33 platforms established in 2018 in four categories, two-in-a-box leadership, Platform Council | DBS Annual Report 2018, CIO statement; MIT CISR research briefing, 2022 (which dates the 33 to 2019) | Reported by DBS, independently described |
| 20% of the scorecard on digital transformation driving compensation, 40% on strategic initiatives | David Gledhill, McKinsey interview, April 2018 | Reported, executive interview |
| Reviews mandated on control towers and live dashboards | Piyush Gupta, McKinsey blog, February 2025. McKinsey advised DBS on the model, so the source is not independent | Reported, adviser-published |
| Managing through Journeys from 2021, more than 60 journeys covering over 60% of revenue by 2024 | DBS Annual Report 2022; IMD case DBS (B), December 2024 | Reported by DBS, case-study figure |
| 30,000 code releases a month in 2019 and 64,000 in 2022 | DBS annual reports 2019 and 2022 | Reported by DBS |
| 1.8 times capital multiplier, about S$1.6bn, and a six-month pause on non-essential IT changes | MAS media releases, 5 May 2023 and 1 November 2023 | Measured, regulator record |
| A smaller organisation should start with four to eight platforms and the shared scorecard line | My own read, from operating-model work with mid-market firms and agencies | My call |
Sources
- DBS Group. (2019). Annual Report 2018: CIO statement.
- DBS Group. (2020). Annual Report 2019: CIO statement.
- DBS Group. (2023). Annual Report 2022.
- DBS Group. (2024). Annual Report 2023.
- HV, V. (2018). Transforming a bank by becoming digital to the core (interview with David Gledhill). McKinsey & Company.
- McKinsey & Company. (2025). An inside look at how McKinsey helped DBS become an AI-powered bank.
- Woerner, S. L., Reynolds, H., Harte, S., & Weill, P. (2022). Replatforming: Securing board and top management team buy-in. MIT CISR Research Briefing.
- Meehan, S., Challagalla, G., & Abraham, P. C. (2024). DBS (B): Managing through customer journeys. IMD.
- Gupta, P. (2017). Our digital strategy [Investor Day presentation]. DBS Group.
- Sengupta, J. (2017). The digital reinvention of an Asian bank (interview with Piyush Gupta). McKinsey Quarterly.
- Monetary Authority of Singapore. (2023). MAS imposes further additional capital requirement on DBS Bank for disruption of banking services.
- Monetary Authority of Singapore. (2023). MAS imposes six-month pause on DBS’ non-essential activities.
Where to start this quarter
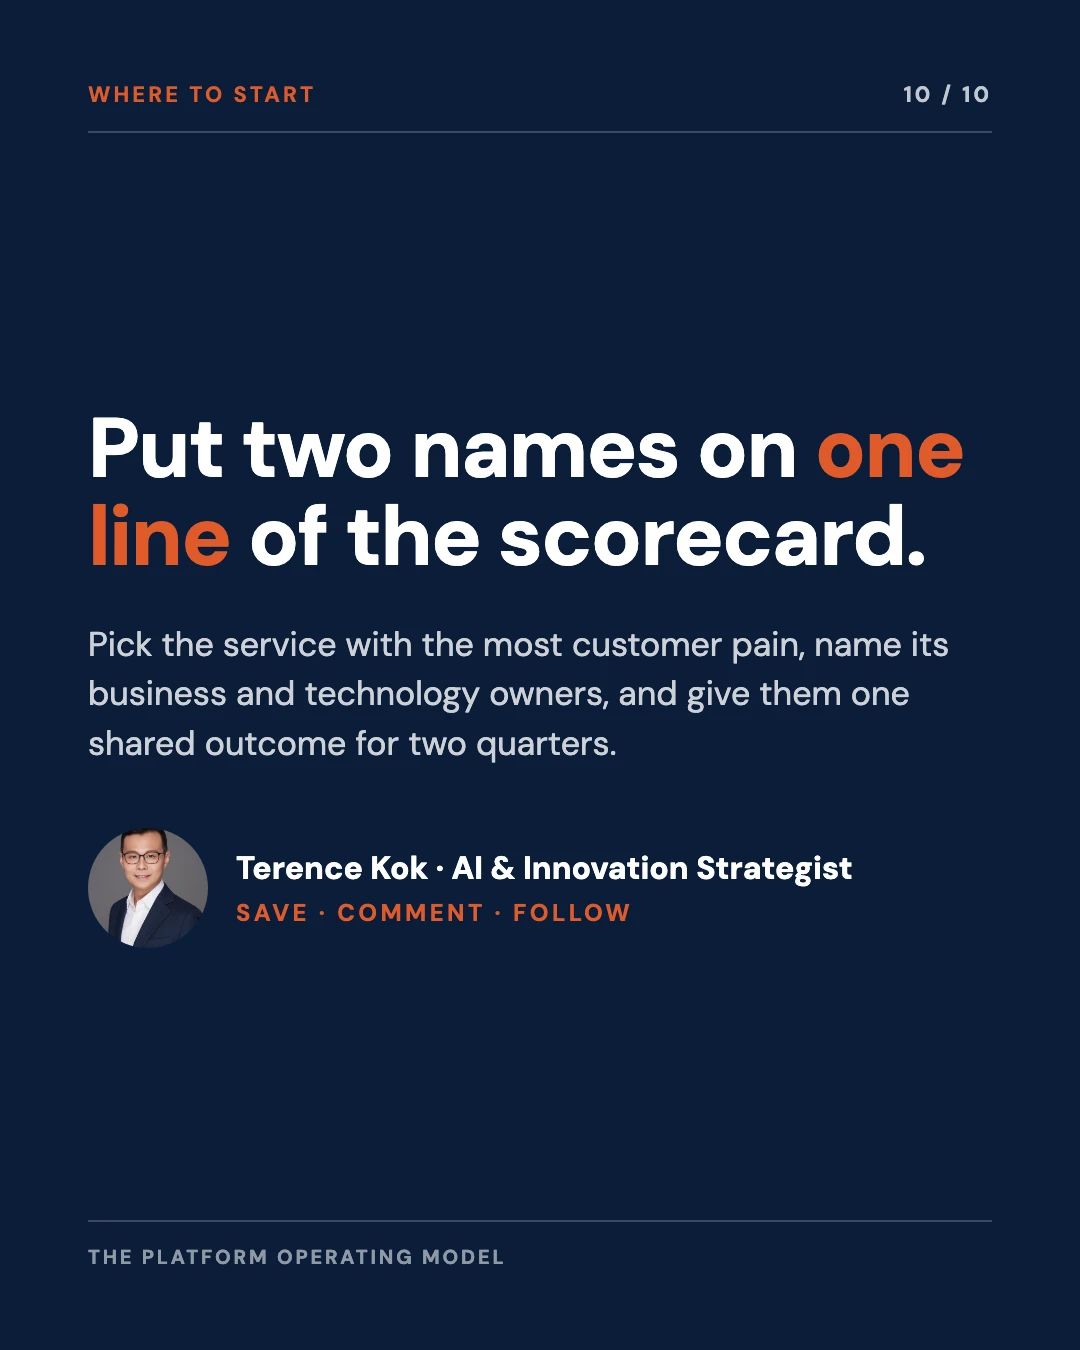
List every technology person and every system in the organisation and try to assign each to one customer-facing service. The items that will not fit anywhere show where the platform boundaries need to be drawn. Then pick the one service with the most visible customer pain, name its business owner and its technology owner, and give them one shared outcome measure that counts in both their reviews at year end. Run that single pair for two quarters before drawing the rest of the map.

Why Team Design Is the Bottleneck
Why the structure of the team, more than the tools, decides how fast change reaches the customer.

Why Scaling AI Depends on Capability
Where a shared data and AI platform fits alongside the business-aligned platforms.

Why Your AI Budget Could be Backwards
The case for funding standing capabilities against agreed outcomes.
If your organisation is deciding how to structure technology and business ownership before scaling AI, my consulting work covers drawing the platform boundaries and designing the shared scorecard.
Was this useful?