



Listen to this article
Jump to a section
In this article
Executive Summary
Most AI pilots are judged against a starting point that somebody reconstructed after the results came in. Reconstructions flatter the pilot. People remember the busy weeks, pilots are placed where performance was worst, and new tools look better in their first month than in their sixth. In one randomised study, experienced developers took 19 per cent longer with AI tools and still believed afterwards that they had been 20 per cent faster. A baseline that finance can rely on is recorded before the first production model call. It defines the outcome as finance counts it, takes the data from systems of record across a full business cycle, and measures how much the number moves on its own. That natural movement decides how long the pilot must run and whether a before-and-after comparison can detect the target at all. The record fits on one page, and the CFO signs it.
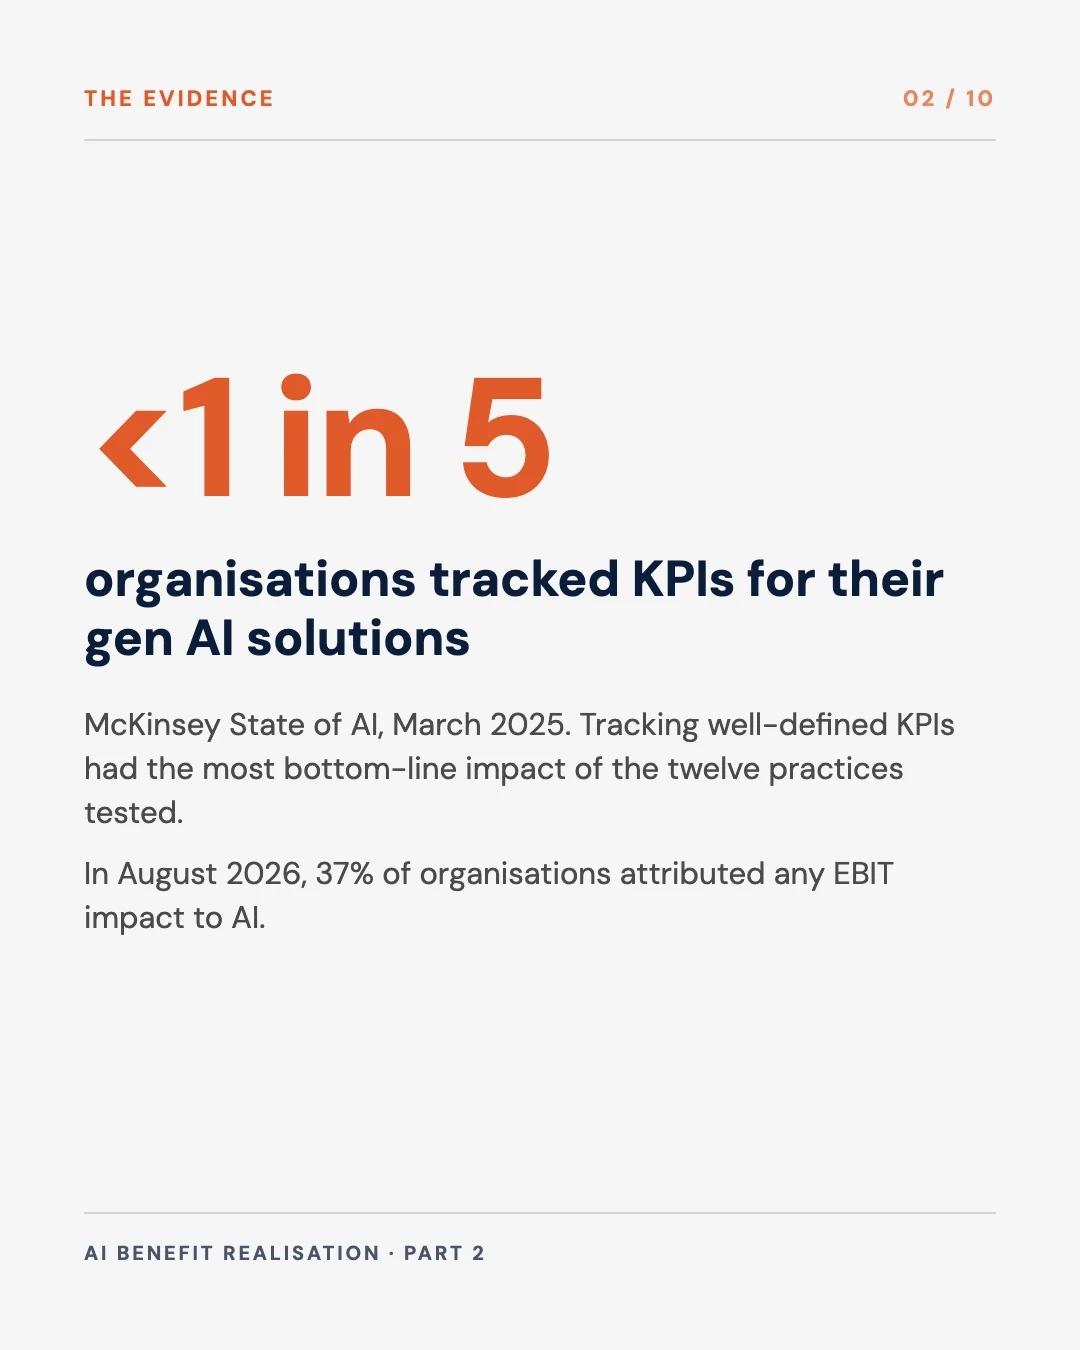
<1 in 5
organisations tracked KPIs for their gen AI solutions, McKinsey State of AI, March 2025
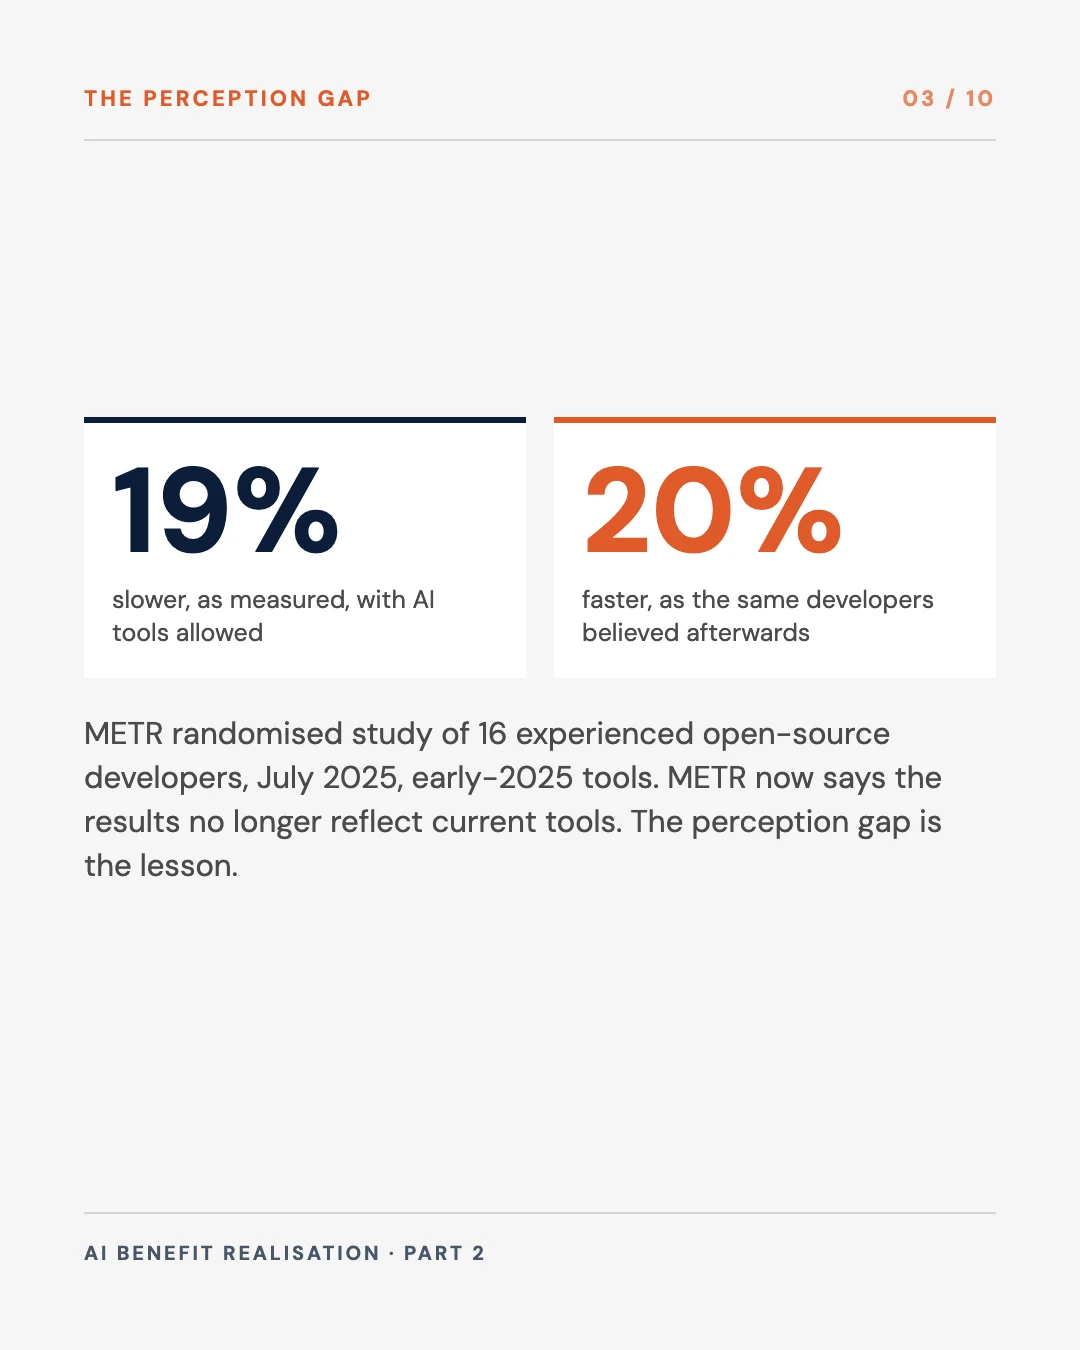
19% / 20%
slower with early-2025 AI tools, as measured, against the 20% speedup the developers believed they had, METR, 2025
~50%
variance reduction at Bing from using pre-experiment data in controlled experiments, Deng et al., 2013
37%
of organisations attribute any EBIT impact to AI, McKinsey State of AI, August 2026
Core conclusions
- Record the baseline before the pilot starts, from systems of record, across at least one full business cycle. Estimates from the team that will run the pilot, or recollections gathered afterwards, should not be accepted.
- Measure the natural variance and work out the smallest change the pilot could detect. If the business case needs a smaller gain than that, the pilot needs a longer run or a control group before it starts.
- Put the baseline on one page, with a quality guardrail, the cost to serve, the target, the kill threshold and the plan for released time, and have finance sign and freeze it.
The argument, in ten slides
Save it, or send it to whoever approves your next AI pilot.

This is the second part of the series Christina and I are writing on AI benefit realisation. Part 1 set out four controls that the CFO and the Chief AI Officer sign together: a baseline, an attribution method, a cost-per-outcome line and stage-gates. This part takes the first of them in detail, because every later control depends on it. An attribution method compares results against the baseline, the cost line is set against the benefit the baseline defines, and a gate decision is only as good as the starting point it measures from.
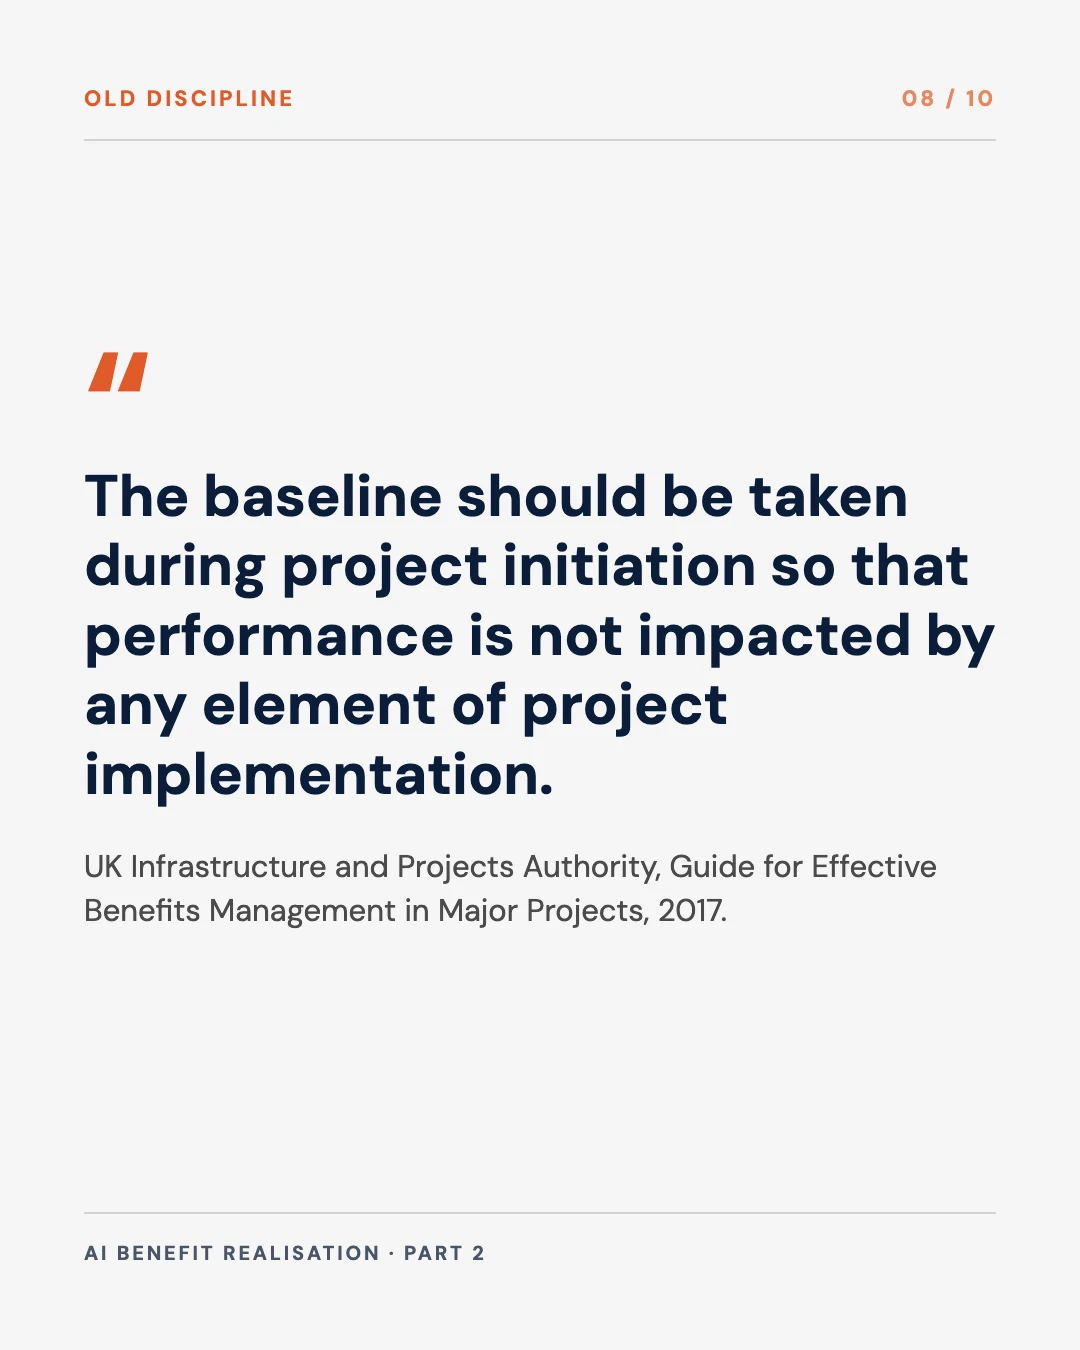
The habit is old and widely documented. The UK Infrastructure and Projects Authority’s guide to benefits management says the baseline “should be taken during project initiation so that performance is not impacted by any element of project implementation.” HM Treasury’s evaluation guidance, the Magenta Book, adds that it “may be necessary to find an appropriate comparison group or collect baseline data before implementation so that a counterfactual can be estimated.” The habit is still rare in AI. McKinsey’s March 2025 State of AI survey found “less than one in five” respondents saying their organisations tracked KPIs for gen AI solutions, and it found that tracking well-defined KPIs was the practice with the most impact on the bottom line of the twelve it tested. Its August 2026 survey found 37 per cent of organisations attributing any EBIT impact to AI, essentially unchanged from the year before.
Why a late baseline flatters the pilot
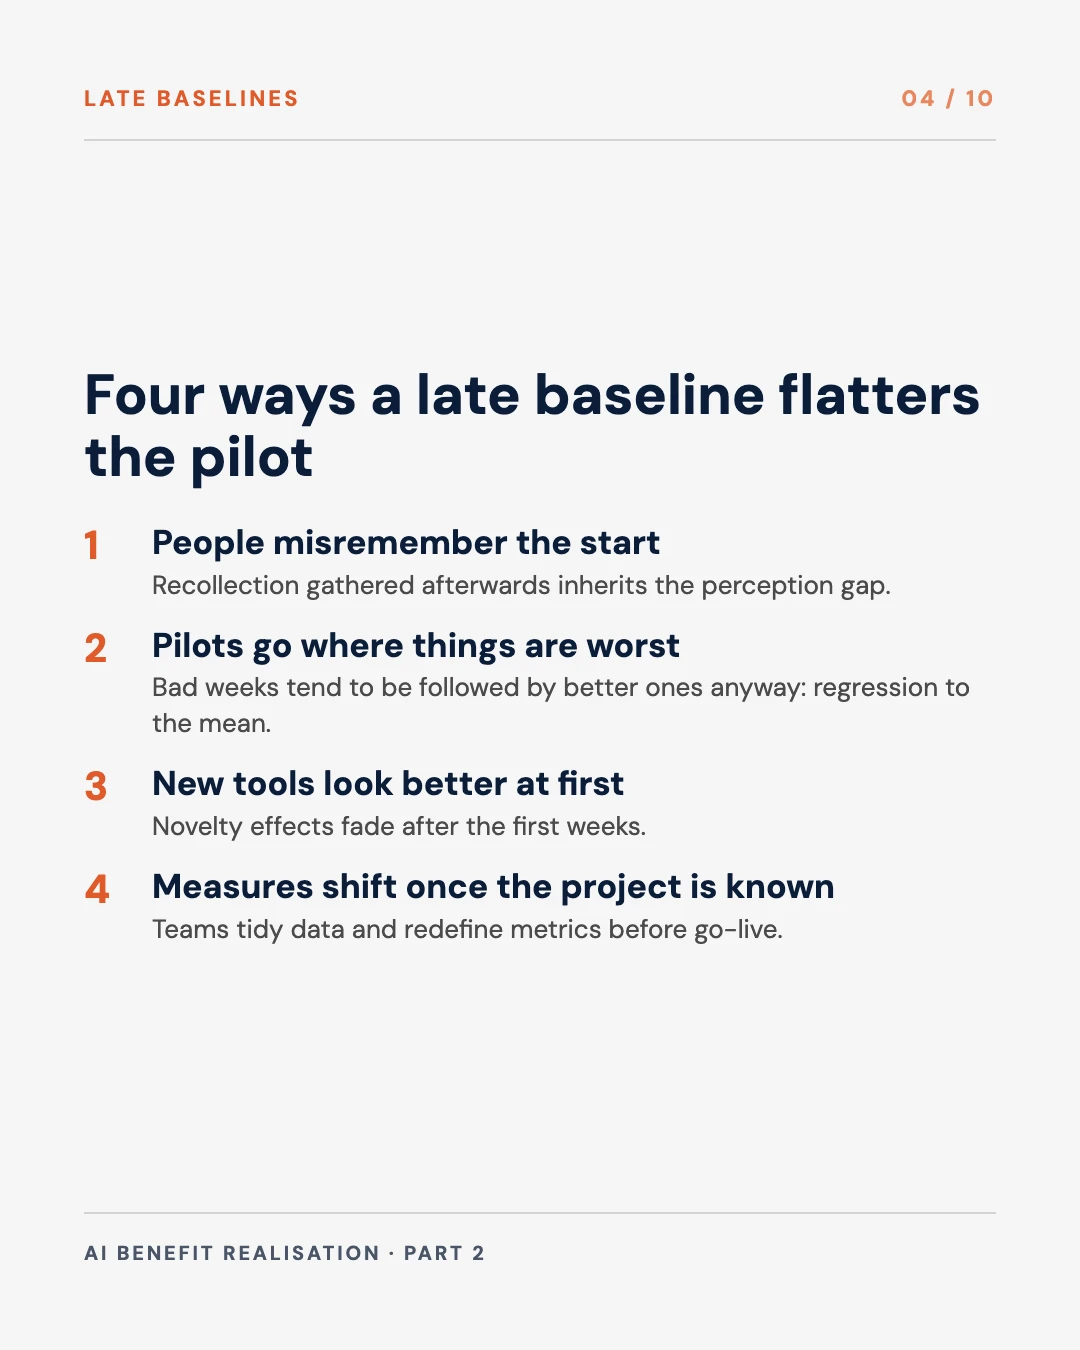
A baseline written after the pilot has started tends to make the pilot look better than it was. We see four reasons, and none of them requires anyone to act in bad faith.
People misremember the starting point. METR’s 2025 randomised study of 16 experienced open-source developers found that, with early-2025 AI tools allowed, they took 19 per cent longer to complete their tasks. Before the study they expected a 24 per cent speedup. Afterwards, they “still believed AI had sped them up by 20%.” METR has since said those results no longer reflect current tools, and its 2026 follow-up gave what it called “an unreliable signal” of today’s effect. The perception gap is the part that matters here. Capable people, who had just done the work themselves, misjudged the effect by a wide margin. A baseline gathered from recollection after the event inherits the same error.
Pilots go where performance is worst. A pilot is usually placed in the team with the longest queue or the highest error rate, and usually in the month the problem was most visible. Statisticians call what follows regression to the mean. Unusually high or low measurements tend to be followed by ones closer to the average, with or without an intervention. A baseline taken from the worst month credits the AI with an improvement that would have happened anyway.
New tools look better at first. Practitioners of online experiments describe novelty and primacy effects, in which early results differ from the settled effect because users are reacting to the change itself. A baseline compared only against the first few weeks of a pilot may record a gain that fades.
Measures shift once the project is known. The UK government’s guidance on evaluating AI interventions notes that a baseline can be affected “before it is actually rolled out in anticipation of the intervention taking place.” Teams tidy their data, change a process or redefine a metric while the pilot is being prepared. The guidance’s answer is to collect baseline data “at a point where the outcomes of interest are not yet affected by the intervention.”
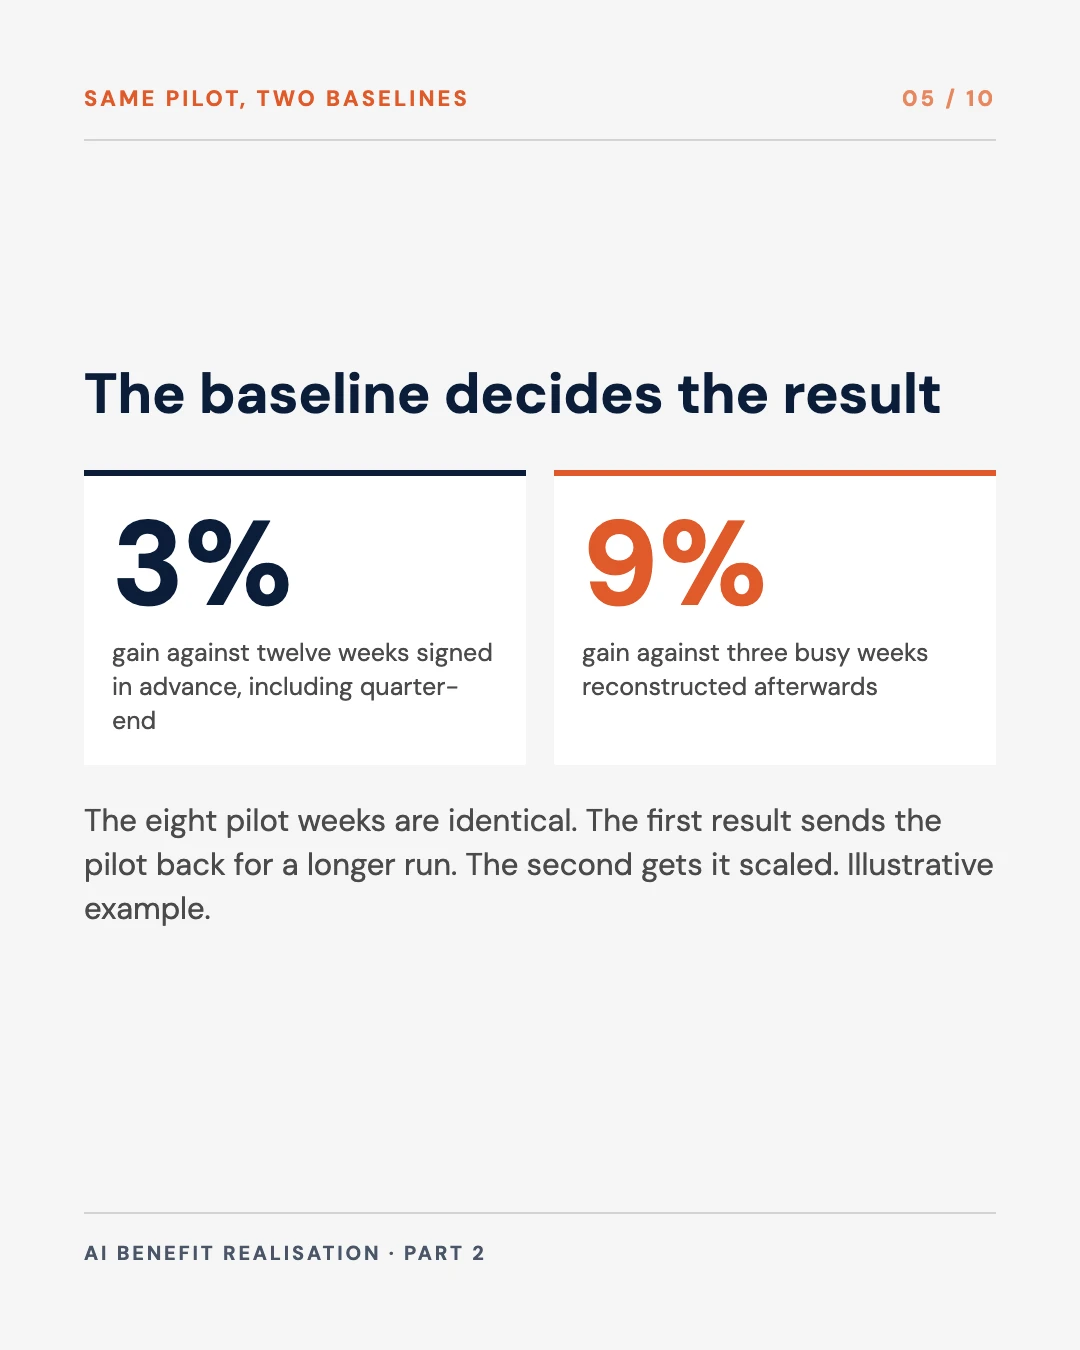
The figure below shows how much this can matter. The eight pilot weeks are identical in both views. Only the baseline changes.
One pilot judged against two baselines
Signed in advance: twelve weeks, including quarter-end, average 9.0 minutes. The pilot averages 8.7, a gain of 3 per cent, which is inside the normal weekly movement.
Illustrative series for a contact-centre pilot, built for this post. The pilot weeks are identical in both views; only the baseline changes.
In the example, the signed baseline covers twelve weeks including a quarter-end, and the pilot’s average handling time is 3 per cent better. Reconstructed afterwards from the three busy weeks that everyone remembers, the same pilot appears 9 per cent better. The first result would send the pilot back for a longer run. The second would get it scaled.
Choosing what to measure
The baseline starts with one primary outcome, defined the way finance would count it. Part 1 set out the principle. In practice it means one measure per use case that connects to a cost or revenue line, with a small number of supporting measures recorded alongside it.
| Use case | Primary outcome | Quality guardrail | System of record |
|---|---|---|---|
| Contact-centre assistant | Calls resolved per agent hour | Repeat contact within 7 days; complaint rate | Telephony and case-management timestamps |
| Invoice processing | Cost per invoice processed | Payment errors; duplicate payments caught late | Accounts payable ledger and workflow logs |
| Claims assessment | Claims closed per assessor per week | Reopened claims; leakage found at audit | Claims system and audit sample |
| Credit memo drafting | Days from application to credit decision | Memos returned by the credit committee | Loan origination system |
| Month-end close | Working days to close | Post-close adjustments | General ledger and close calendar |
Our examples. Each row pairs a speed or volume measure with a quality measure, so that a loss of quality cannot be reported as a gain in speed.
The quality guardrail matters because the evidence shows speed and quality can move in different directions. In Brynjolfsson, Li and Raymond’s study of 5,172 customer-support agents, productivity rose by 15 per cent on average and by 30 per cent for novice and lower-skilled workers, while “the most experienced and highest-skilled workers see small gains in speed and small declines in quality.” A baseline that records only speed would have reported the second finding as a success.
Two more items belong in the baseline. The first is the current cost to serve, the fully loaded cost of producing one outcome today, so that part 4 of this series can set the AI’s running cost against the benefit in the same unit. The second is the likely disbenefits. The UK benefits guide defines a disbenefit as “the measurable decline resulting from an outcome perceived as a negative by one or more stakeholders” and observes that “project teams are reluctant to be forthcoming with disbenefits.” For an AI pilot these are often a rise in escalations, more work for a review team downstream, or a slower process for the customers the model handles badly. They can only be measured later if they were baselined first.
How long to measure
The measurement period should cover at least one full business cycle. For a contact centre that usually means a quarter, so that the quarter-end peak and the quiet weeks are both in the record. For a finance process it means at least three month-end closes, including a quarter-end. For anything seasonal, such as insurance claims after a monsoon or retail returns after a festive period, it means data from the same season in the previous year.
The data should be recorded weekly, because weekly figures show the trend and the spread, both of which a single monthly average hides. Where the history already exists in the system of record, pulling a year of weekly data is usually a few days’ work. Where it does not, the section on missing history below applies.
Natural variance decides the pilot length
Every operational measure moves on its own from week to week. Call volumes change, staff take leave and the mix of work shifts. The size of that movement, which statisticians call the variance or the spread, decides how large an improvement must be before it can be told apart from noise.
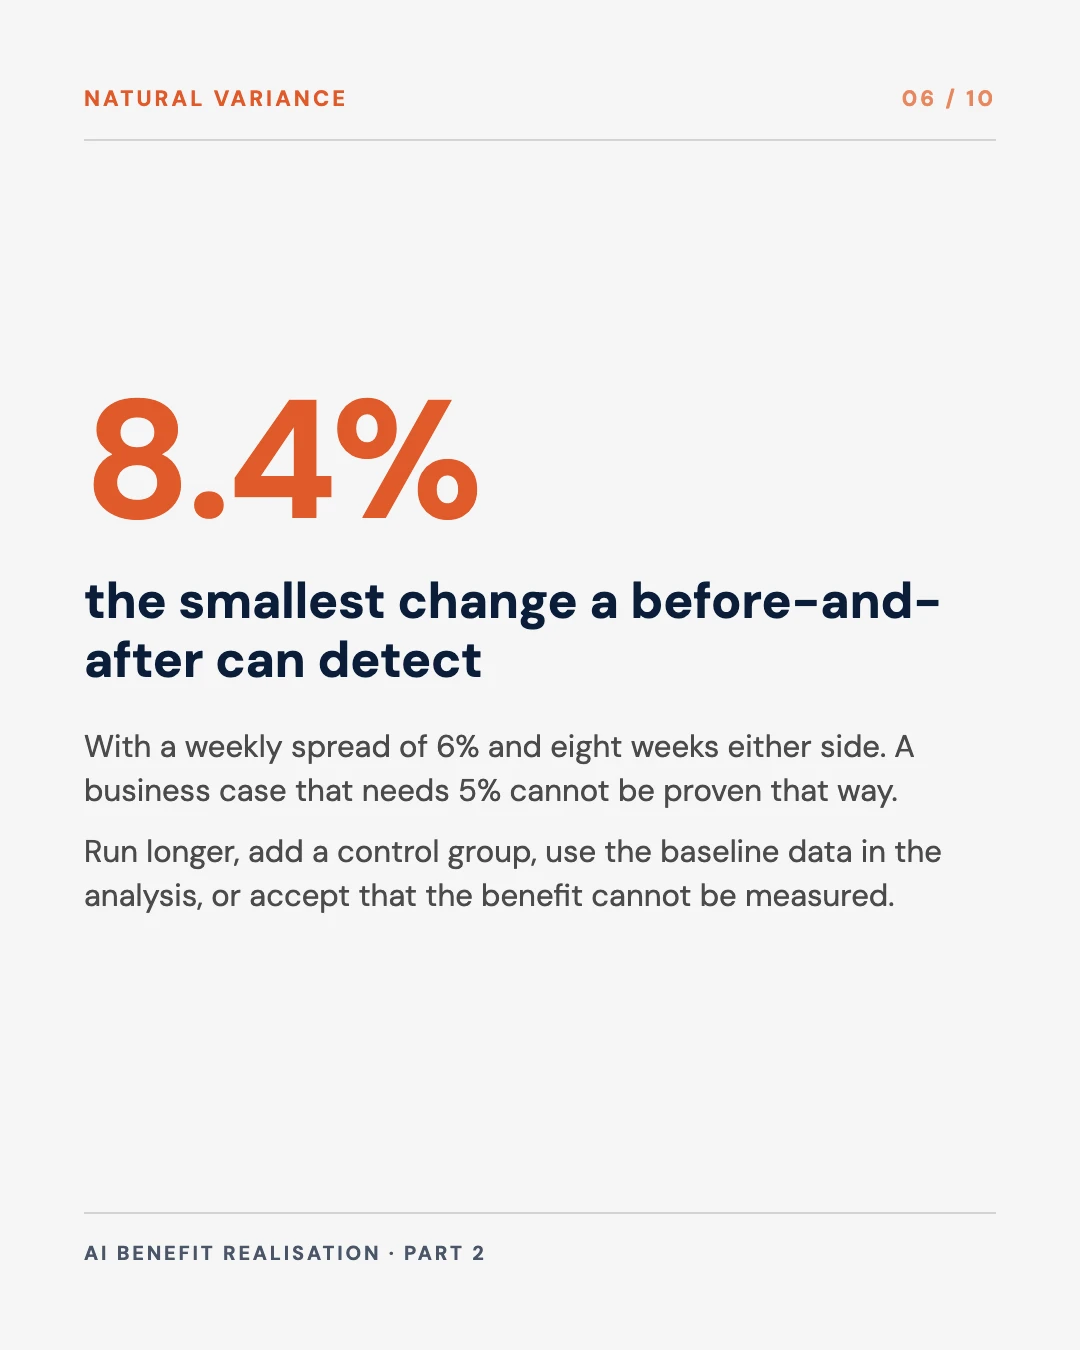
A simple rule applies to a before-and-after comparison of weekly averages. The smallest change it can reliably detect is about 2.8 times the weekly spread, multiplied by the square root of one over the number of baseline weeks plus one over the number of pilot weeks. The 2.8 corresponds to the usual standard of 80 per cent power at 5 per cent significance. Take a measure whose weekly spread is 6 per cent of its average. With eight weeks of baseline and eight weeks of pilot, the smallest detectable change is about 8.4 per cent. A business case that needs a 5 per cent gain cannot be proven by that comparison, however well the pilot goes.
The smallest improvement a before-and-after comparison can detect
Inside the noise: a 5% improvement cannot be told apart from normal weekly movement. Run longer, or use a control group.
Simplified rule for comparing average weekly results before and during a pilot, at 80 per cent power and 5 per cent significance: 2.8 times the weekly spread times the square root of (1 / baseline weeks + 1 / pilot weeks). It assumes stable, independent weeks with no trend. Real weeks are usually correlated, which makes the detectable change larger. Illustrative; set your own figures.
The calculation should be done before the pilot is approved, and there are four ways to respond when the target sits inside the noise.
- Run longer. More weeks on both sides narrow the band, but slowly. Doubling both periods reduces the detectable change by only about 30 per cent.
- Add a control group. A staggered rollout or a holdout compares the pilot with teams measured over the same weeks, so the movement they share cancels out. This is the subject of part 3.
- Use the baseline data in the analysis. When a control group exists, each unit’s own pre-pilot history can be used to remove part of the noise. The method, known as CUPED, was developed for online experiments at Microsoft. Its authors reported that at Bing it reduced variance “by about 50%”, giving the same statistical power with about half the sample or half the duration. The method works only if the baseline was recorded at the level of the team or the case, and before the pilot began.
- Accept that the benefit cannot be measured. Some targets are too small for the volume available. That is a legitimate finding, and in part 1 it is the fourth kill criterion. It is cheaper to reach it at approval than at Gate 1.
The rule above assumes stable, independent weeks. Real operational weeks are usually correlated with each other and often trend, both of which make the detectable change larger. The calculation therefore sets a lower bound, and the real figure is likely to be higher.
The one-page baseline record
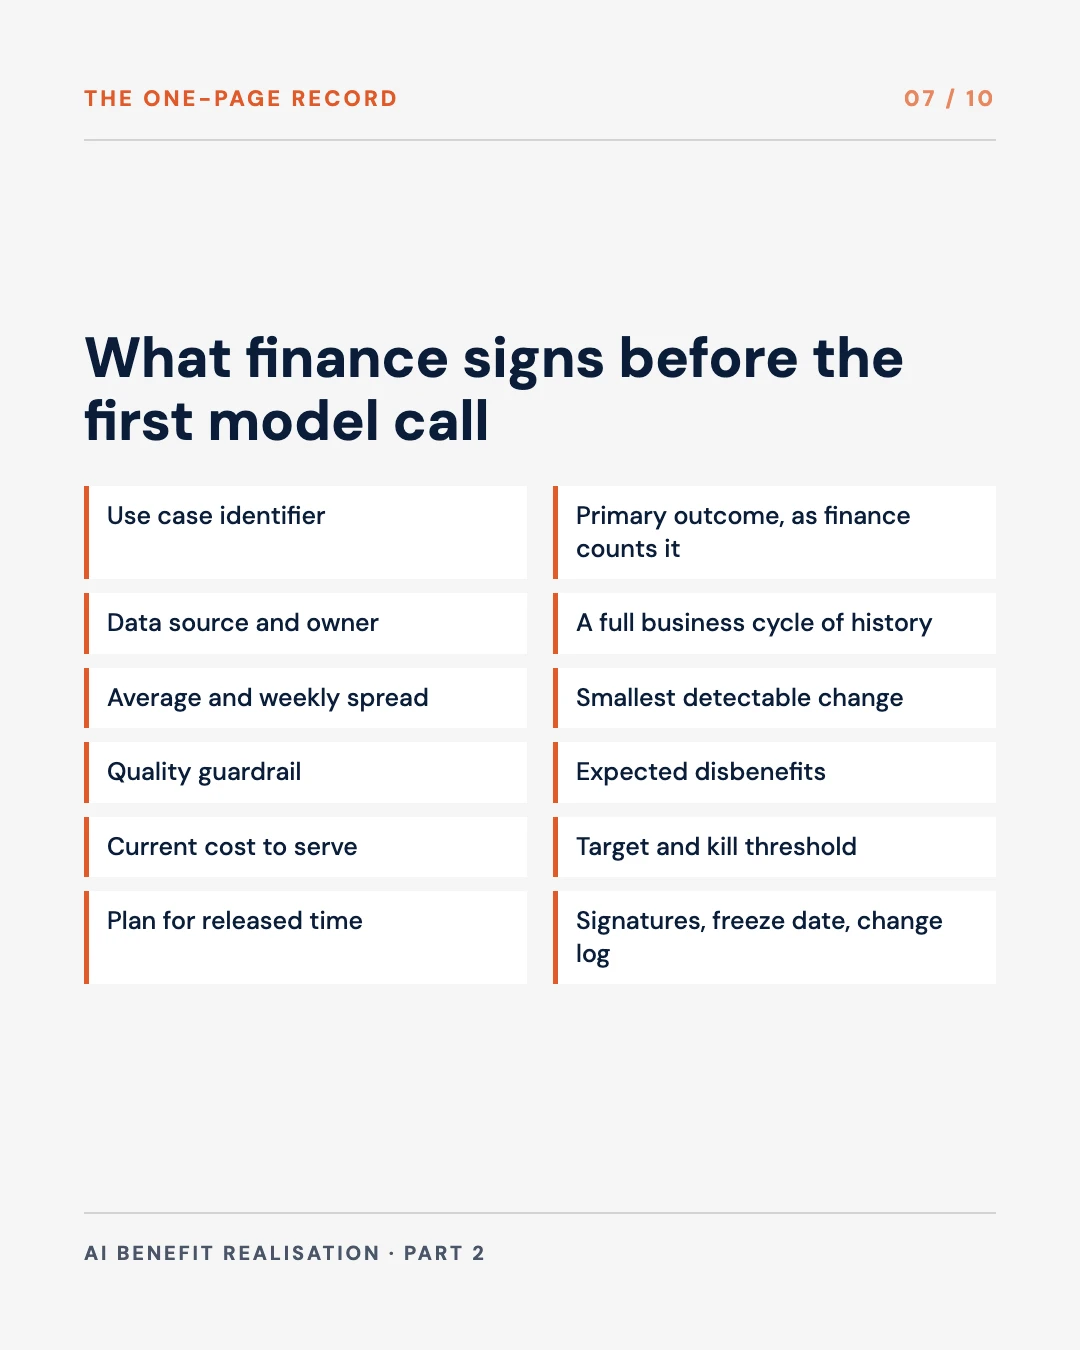
All of this fits on one page. We would make it a standard template in the AI investment process, filled in by the CAIO’s team and signed by finance.
| Field | What it holds | Contact-centre example |
|---|---|---|
| Use case identifier | The same identifier used to tag model calls and costs | CC-ASSIST-01 |
| Primary outcome | Definition, unit and how finance counts it | Calls resolved per agent hour, from the case system |
| Data source and owner | System of record, extract method, named data owner | Telephony platform and CRM; Head of Contact Centre Operations |
| Measurement period | Dates, and why they cover a full cycle | 13 weeks to 30 September, including quarter-end |
| Average and weekly spread | The baseline level and how much it moves each week | 4.1 calls per hour; weekly spread 6 per cent |
| Trend and seasonality | Any drift or peaks the period revealed | Flat trend; quarter-end weeks 8 to 10 per cent lower |
| Smallest detectable change | For the attribution method chosen | 7.5 per cent before-and-after over an eight-week pilot; lower with a staggered rollout |
| Quality guardrail | Measure and the level it must not breach | Repeat contacts within 7 days no more than 12 per cent |
| Expected disbenefits | What might get worse, and how it will be measured | Escalations to supervisors; supervisor review hours |
| Current cost to serve | Fully loaded cost of one outcome today | S$9.40 per resolved call |
| Target and kill threshold | The gain that justifies scaling and the floor below which funding stops | Target 12 per cent; kill below 5 per cent |
| Plan for released time | What happens to capacity if the target is met | Absorb volume growth for two quarters, then no backfill of leavers |
| Signatures and freeze date | CAIO-side owner, finance owner, date | Signed and frozen before the first production model call |
| Change log | Every later change to a definition or a data source, with the reason | Empty at signature |
Our proposed template. The example figures are illustrative.
Two fields deserve a comment. The use case identifier ties the baseline to the cost tagging described in part 1, so that benefit and cost are reported against the same thing. The plan for released time is the field most often left blank, and the next section explains why it should be filled in.
Who signs and when
The baseline is signed before the first production model call, and the sequence leading to the signature can be short.
Six steps from choosing the outcome to the first model call
Our proposed sequence. Steps 1 to 5 sit inside Gate 0 of the stage-gates in part 1 of this series; a pilot that has not reached step 5 is not ready to start.
Three rules keep the record honest. The historical data is pulled by someone outside the pilot team, usually finance or the data owner, from the system of record. The definitions are frozen at signature, and any later change goes in the change log with a reason, so that a redefined measure cannot pass without notice. And the people who will judge the result agree the measures in advance. The UK benefits guide puts the same expectation on its programmes, “ensuring those responsible for quantifying benefits have agreed baselines and signed off the level of benefits expected.”
For Singapore financial institutions there is a parallel in the guidelines MAS finalised on 7 October 2026. They deal with AI risk rather than benefits, but they expect performance thresholds to be “clearly defined, documented, and mutually agreed upon by business owners, developers and reviewers.” A baseline record signed by the CAIO’s team and by finance applies the same discipline to the benefit side. We found no Singapore guidance that requires a benefits baseline for AI, so this is a practice we recommend. No regulation demands it today.
When there is no clean history
Some pilots have no usable history. The process may be new, the measure may never have been recorded, or the data may sit in spreadsheets nobody trusts. Reconstructing a baseline from estimates is the wrong response. There are three better ones.
A shadow measurement period. Instrument the process and measure it for four to eight weeks before the AI goes live. It delays the pilot, but it is the only way to get a baseline from the same source and on the same definition as the pilot results.
Sampled measurement. Where full instrumentation is impractical, measure a random sample of cases by hand, such as the time taken on a hundred randomly chosen claims. A small random sample is more reliable than a large estimate.
A control group from day one. If the baseline cannot be measured before the pilot, measure a comparison group during it. A holdout or a staggered rollout makes the concurrent comparison group the reference point, which removes much of the dependence on history.
What should not be accepted is a baseline built from the pilot team’s estimates, from vendor benchmarks or from another organisation’s published results. These may be useful for sizing a business case, and they are no basis for measuring a result.
Time released needs a plan in the baseline
Most AI pilots release time before they release cash, and the baseline is where that difference should be planned. The largest study so far points the same way. Humlum and Vestergaard linked surveys of Danish workers in exposed occupations to administrative records. Workers who used AI chatbots reported saving about 3 per cent of their work hours, and the researchers found “precise null effects on earnings and recorded hours,” ruling out effects larger than 2 per cent two years after ChatGPT launched. Most users said they reallocated the saved time to other tasks. The time was saved, and it did not show up in hours or pay.
That outcome is legitimate if the organisation intended it. The problem arises when the business case promised a cost reduction and the released time went into other work. The baseline record should therefore state in advance which kind of benefit is expected: capacity to absorb growth, cost avoided, cost removed or revenue. Part 1 made the reporting rule that time released is reported as capacity until cost leaves the budget. Writing the plan into the baseline means the CFO and the CAIO agree on the type of benefit before anyone has a result to defend.
What to do before the next pilot
- Adopt the one-page record. Make it a required attachment to every AI pilot request, with no exceptions for small pilots.
- Pull history from systems of record. At least one full business cycle, weekly, extracted by someone outside the pilot team.
- Work out the smallest detectable change. Compare it with the target before approval, and add a control group or a longer run where the target sits inside the noise.
- Pair every speed measure with a quality guardrail. Record likely disbenefits at the same time.
- State the plan for released time. Capacity, cost avoided, cost removed or revenue, chosen in advance.
- Sign and freeze. Finance signs before the first production model call, and every later change goes in the change log.
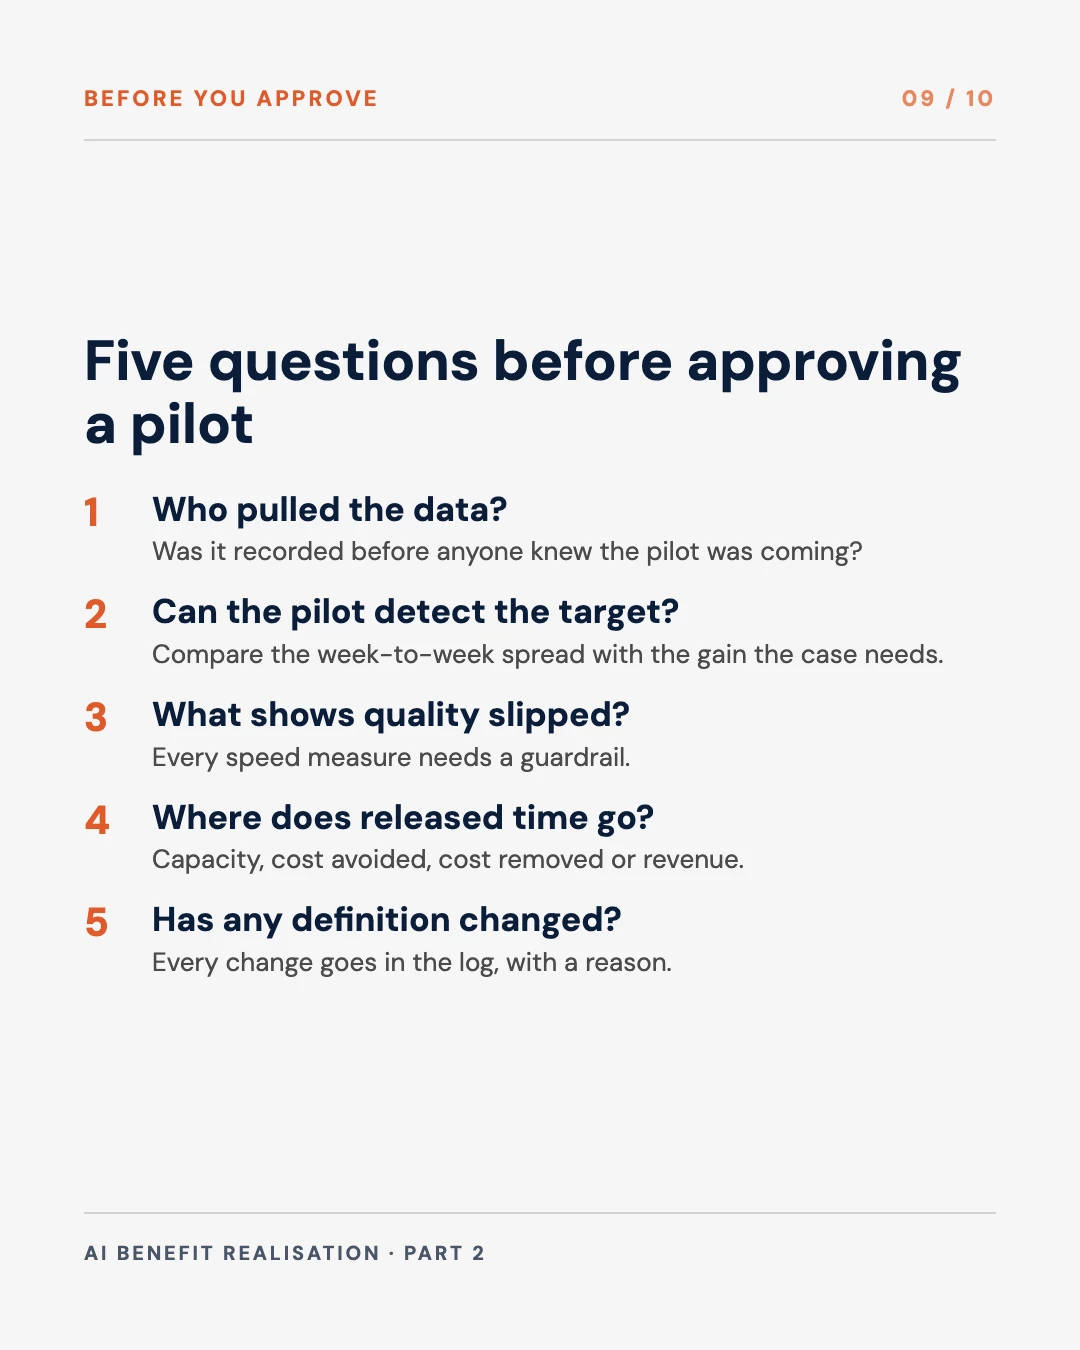
Questions to ask before approving a pilot
- Was this baseline recorded before anyone knew the pilot was coming, and who pulled the data?
- How much does the primary measure move from week to week, and can the pilot detect the gain the business case needs?
- What quality measure would show that the speed gain was bought with errors?
- If the target is met, what happens to the time released, and whose budget changes?
- Has any definition in the baseline changed since it was signed, and why?
Free tool
AI ROI Calculator
Size the potential saving for a team before you commit to a pilot, then set the baseline against the figure you need to prove.
Part 3 takes the attribution question that this part leaves open: how to separate the AI’s effect from everything else that changed during the same weeks, and what each method costs. The series page lists what is planned.
Evidence & Methodology
Survey figures, study results and guidance text come from the publishers’ own pages and documents, read in October 2026. Where a study has been revised, we have used the latest version and its numbers: the QJE text of Brynjolfsson et al. rather than the working paper, and the March 2026 revision of Humlum and Vestergaard. The baseline record, the sequence, the use-case examples and the worked figures are our own proposal and illustrations, and we have marked them as such.
| Claim | Source | Grade |
|---|---|---|
| Less than one in five tracked KPIs for gen AI; KPI tracking had the most bottom-line impact of 12 practices | McKinsey State of AI, March 2025, 1,491 respondents | Reported, executive survey |
| 37% attribute any EBIT impact to AI, essentially unchanged | McKinsey State of AI, August 2026, 1,719 respondents | Reported, executive survey |
| Baseline at project initiation; agreed baselines signed off; disbenefit definition | UK IPA, Guide for Effective Benefits Management in Major Projects, 2017, paras 3.5-3.6, 7.35, 7.69 | Measured, government guidance |
| Baseline data before implementation to estimate a counterfactual | HM Treasury, Magenta Book, May 2026 update | Measured, government guidance |
| Baselines affected in anticipation; collect before outcomes are affected | Guidance on the Impact Evaluation of AI Interventions, Magenta Book supplementary guidance, 2024 | Measured, government guidance |
| 16 developers, 19% slower, expected 24% faster, believed 20% faster | METR, July 2025, randomised controlled trial; METR’s 2026 note that results are out of date | Measured, randomised experiment, early-2025 tools |
| Regression to the mean | Barnett, van der Pols and Dobson, International Journal of Epidemiology, 2005 | Measured, methods literature |
| Novelty and primacy effects in early results | Kohavi, Tang and Xu, Trustworthy Online Controlled Experiments, 2020 | Measured, methods literature |
| 15% average gain, 30% for novices, quality declines for most experienced | Brynjolfsson, Li and Raymond, Quarterly Journal of Economics, 2025 | Measured, staggered rollout |
| CUPED reduced variance by about 50% at Bing | Deng, Xu, Kohavi and Walker, WSDM 2013 | Measured, company experiment platform |
| Detectable change of 2.8 x spread x square root of (1/n1 + 1/n2); 8.4% worked example | Standard two-sample power calculation at 80% power, 5% significance | Adapted, simplified |
| MAS performance thresholds mutually agreed by business owners, developers and reviewers | MAS Guidelines on AI Risk Management, 7 October 2026, para 5.14(a) | Measured, regulator record |
| No Singapore guidance requires an AI benefits baseline | Our search of MAS, IMDA and GovTech publications, October 2026 | My call |
| About 3% of work hours saved, self-reported; no earnings or hours effects above 2% | Humlum and Vestergaard, NBER WP 33777, revised March 2026 | Measured, administrative data and survey |
| Four reasons a late baseline flatters a pilot; one-page record; six-step sequence; use-case table | Our proposal, adapted from UK benefits and evaluation guidance | My call |
| 3% against 9% gain; contact-centre record figures | Illustrative example built for this post | Illustrative |
Sources
- Infrastructure and Projects Authority. (2017). Guide for effective benefits management in major projects.
- HM Treasury. (2026). The Magenta Book: central government guidance on evaluation.
- Frontier Economics for HM Treasury. (2024). Guidance on the impact evaluation of AI interventions.
- McKinsey & Company. (2025). The state of AI: how organizations are rewiring to capture value.
- McKinsey & Company. (2026). The state of AI in 2026: on the road to ROI.
- METR. (2025). Measuring the impact of early-2025 AI on experienced open-source developer productivity.
- METR. (2026). We are changing our developer productivity experiment design.
- Barnett, A.G., van der Pols, J.C., and Dobson, A.J. (2005). Regression to the mean: what it is and how to deal with it. International Journal of Epidemiology, 34(1), 215-220.
- Kohavi, R., Tang, D., and Xu, Y. (2020). Trustworthy online controlled experiments: a practical guide to A/B testing. Cambridge University Press.
- Brynjolfsson, E., Li, D., and Raymond, L. (2025). Generative AI at work. Quarterly Journal of Economics, 140(2), 889-942.
- Deng, A., Xu, Y., Kohavi, R., and Walker, T. (2013). Improving the sensitivity of online controlled experiments by utilizing pre-experiment data. WSDM 2013.
- Monetary Authority of Singapore. (2026). Guidelines on artificial intelligence risk management.
- Humlum, A., and Vestergaard, E. (2026). Still waters, rapid currents: early labor market transformation under generative AI. NBER Working Paper 33777.

A Joint CFO–CAIO Framework for AI Benefit Realisation
The four controls the baseline belongs to, including the gates and kill criteria that use it.

Why Large Enterprises Are Deploying AI at Scale but Measuring It Incorrectly
The measurement mistakes a signed baseline is designed to prevent.

What DBS's S$1 Billion in AI Value Measures, and How a Board Should Read It
How a control-group method sits behind the best-known AI value number in Singapore.

The Lean Way to Build AI: Small Bets, Real Evidence, Fewer Failed Pilots
Delivery habits that keep a measured pilot cheap to run.
My thanks to Dr. Christina Chua for co-writing this post and the series. Her view of how finance teams approve and review new products shaped the sign-off rules and the plan for released time. Christina is Director, Institutional Sales at Moomoo Financial Singapore. The post does not discuss Moomoo, and the views in it are not Moomoo’s.
If your organisation is about to approve an AI pilot and wants the baseline right first, that is a short piece of work I often start with. My consulting work covers AI governance and investment oversight for boards, finance leaders and public agencies.
Was this useful?