Listen to this article
Executive Summary
As AI moves from pilot to production, a CAIO’s job changes from proving the technology works to proving it’s financially justified, operationally healthy, and risk-contained. Most CAIOs are still instrumented for the pilot phase.
Core conclusions
- Four dashboards (Value & Adoption, Model Performance & Health, Trust/Risk/Governance, and Human-AI Interaction & Decision Quality) cover the accountability areas that a model-accuracy dashboard alone misses.
- Adoption metrics alone are misleading: a system deployed to 500 users but actively used by 50 isn’t an AI success, it’s a change-management problem the dashboard is designed to surface early.
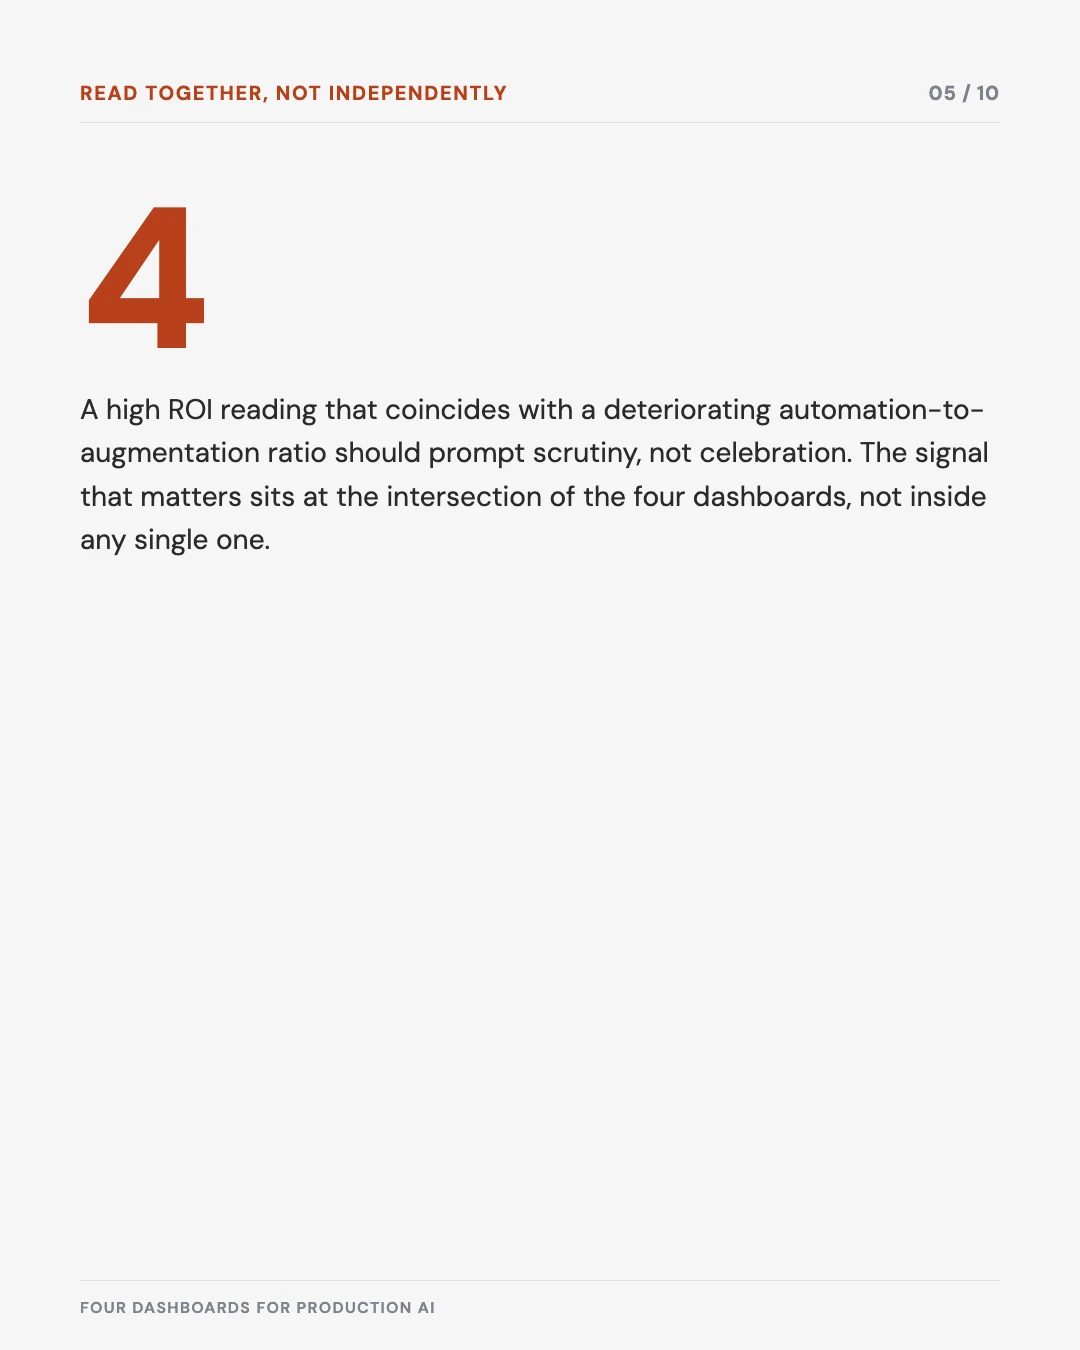
- The four dashboards have to be read together, not independently. The most important warning signals sit at the intersections, such as a high ROI figure masking a declining automation-versus-augmentation ratio.
The four dashboards, in ten slides
Save it, share it, or hand it to the CAIO who’s still running on model-accuracy metrics alone.
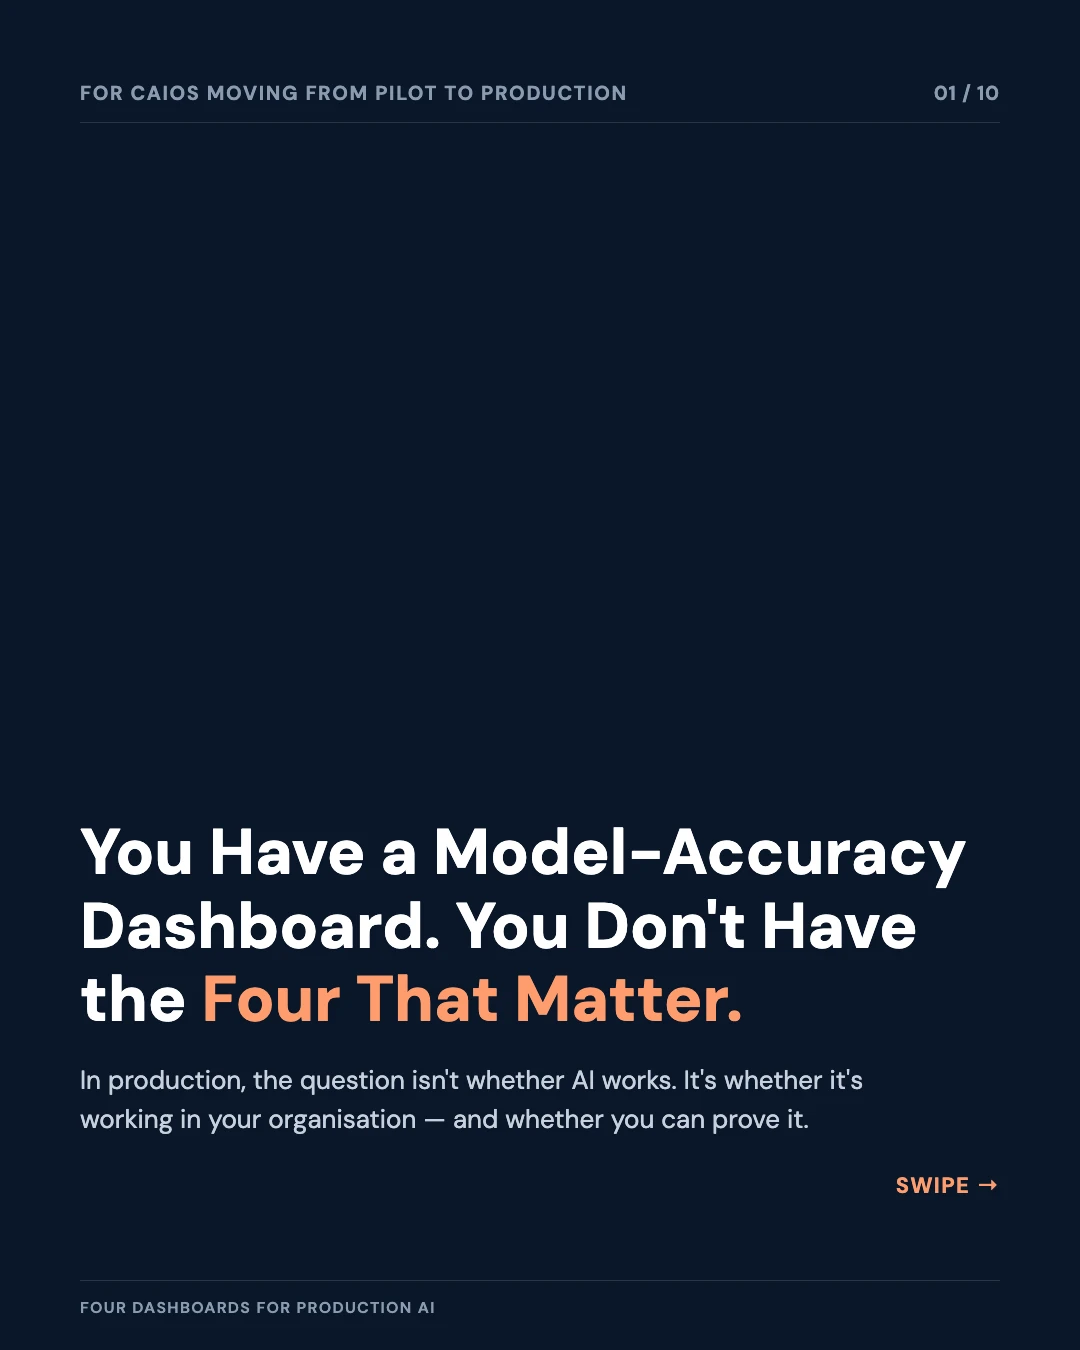
There is a specific moment when AI leadership changes character. In the pilot phase, the role is about possibility: convincing leadership that the technology works, securing budget, and demonstrating what AI can do. In production, the role changes entirely. Now the question is not whether AI works in principle. The question is whether it is working in your organisation, whether the investment is justified, and whether the risks are being managed.
Most Chief AI Officers are not prepared for this shift. They have dashboards for model accuracy and tool adoption. They do not have dashboards for the things leadership actually needs to see: financial return, operational health, governance compliance, and workforce impact. The result is that AI programmes that are technically functional remain in political limbo, unable to make the case that they belong in the organisation’s operating infrastructure rather than its innovation budget.
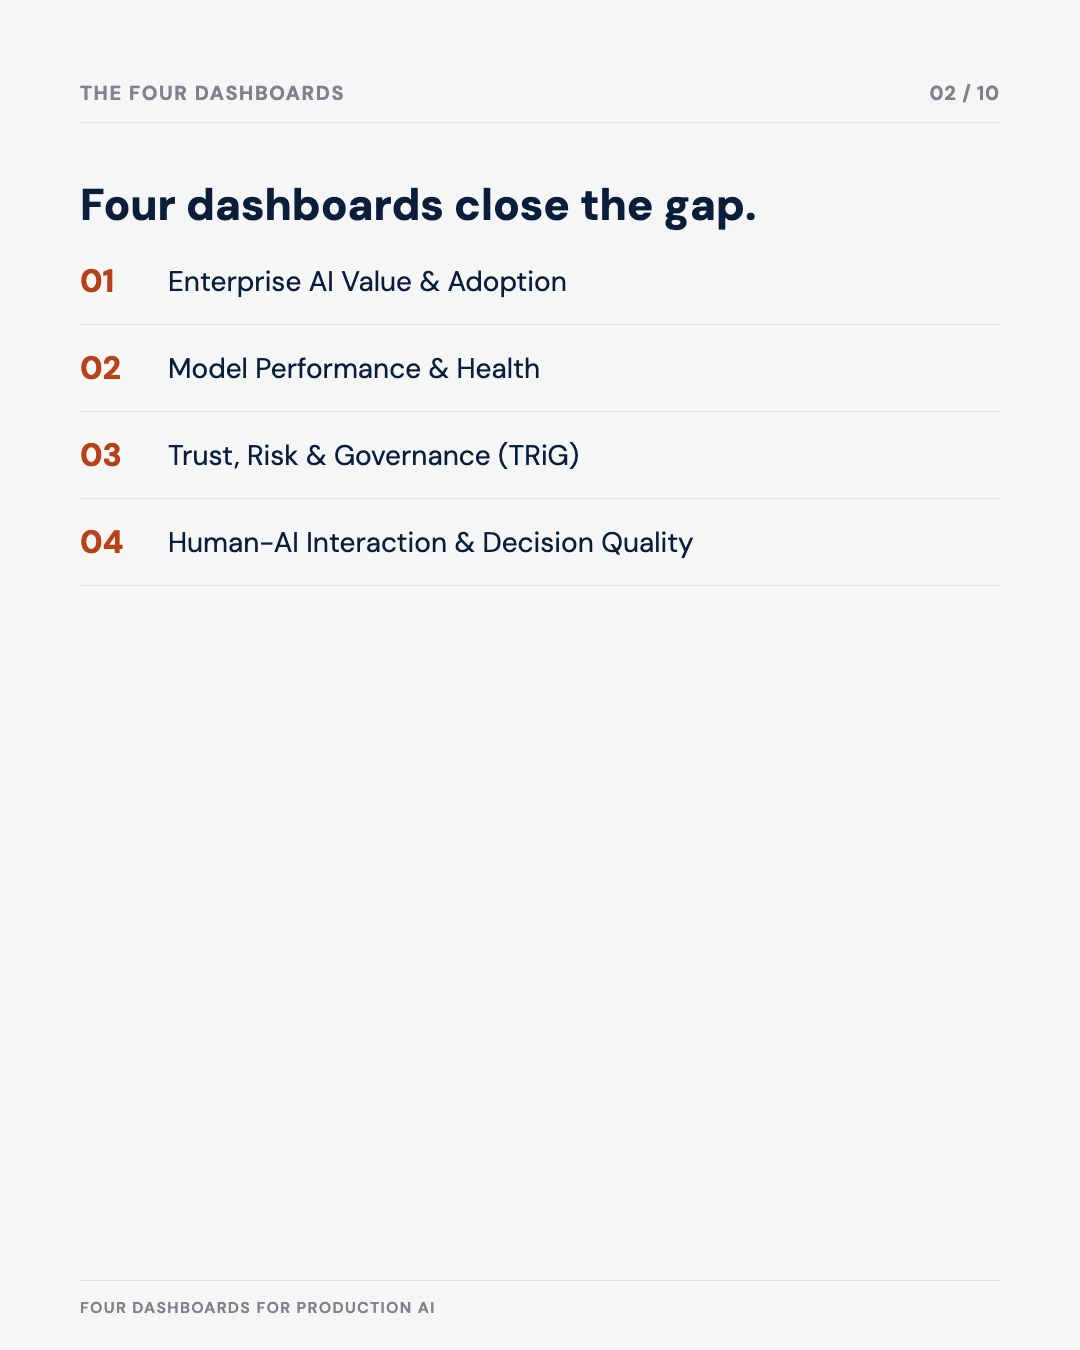
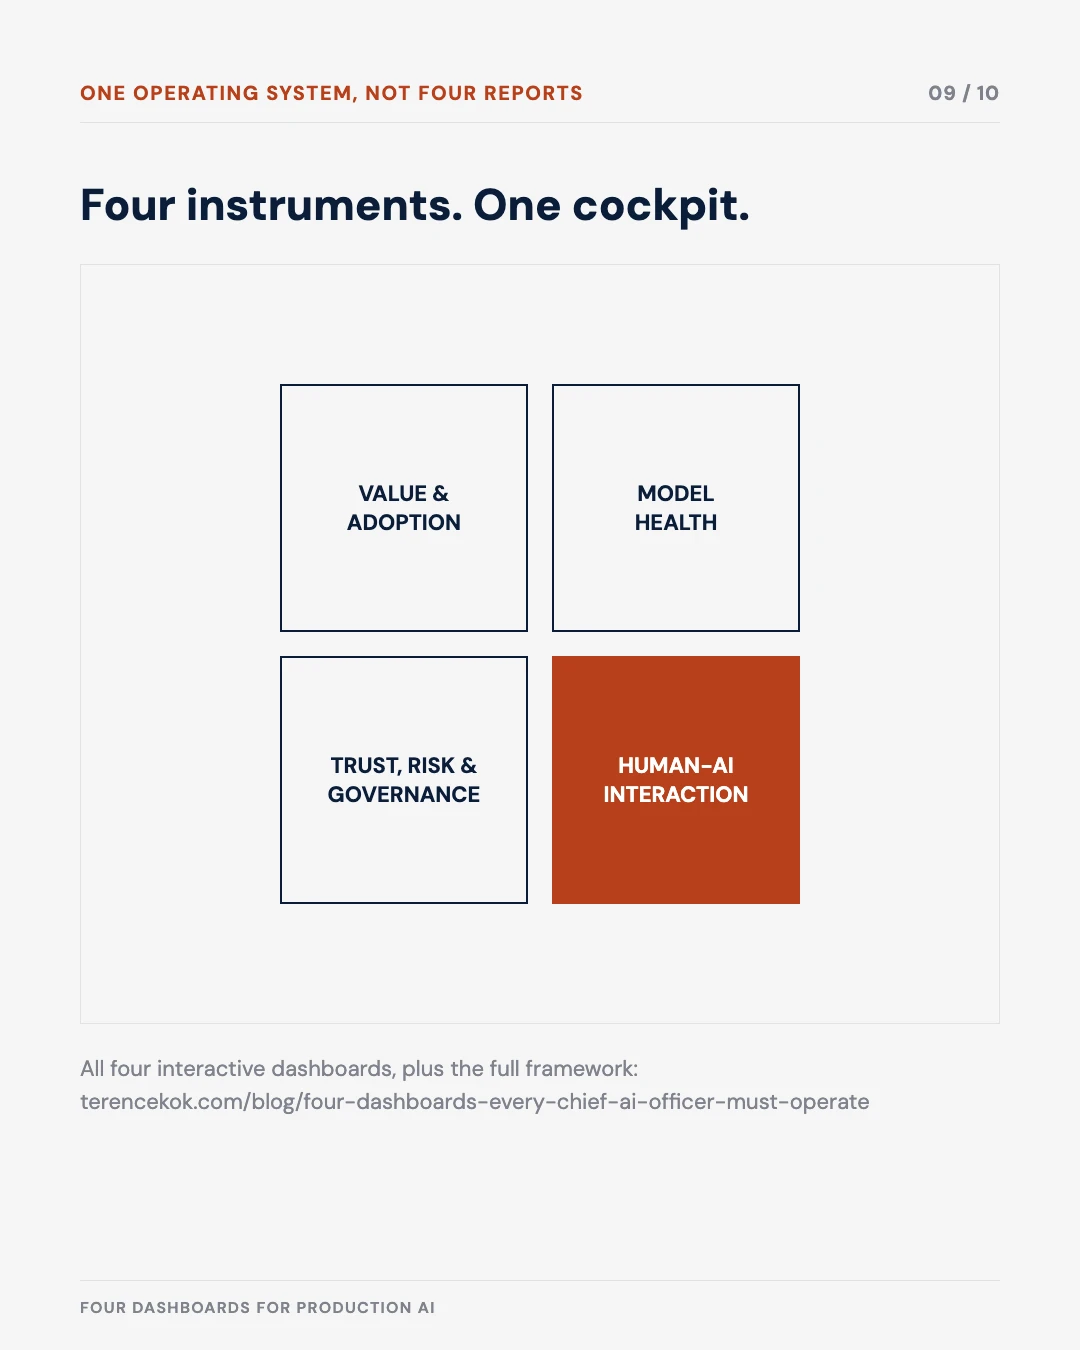
Four dashboards close that gap. Each addresses a distinct area of accountability. Together, they demonstrate managed transformation rather than ongoing experimentation.
1. Enterprise AI Value & Adoption Dashboard
The first accountability question from any board or executive committee is financial: what is this costing, and what are we getting back? The Enterprise AI Value & Adoption Dashboard answers that question with precision.
The financial baseline starts with Total Cost of Ownership: cloud and compute costs, licensing, training, and the internal engineering time that often goes unaccounted. Against that baseline, you track AI-Influenced Revenue and Savings: the revenue attributable to AI-assisted decisions, the labour costs avoided through automation, and the process improvements that have been quantified rather than estimated.
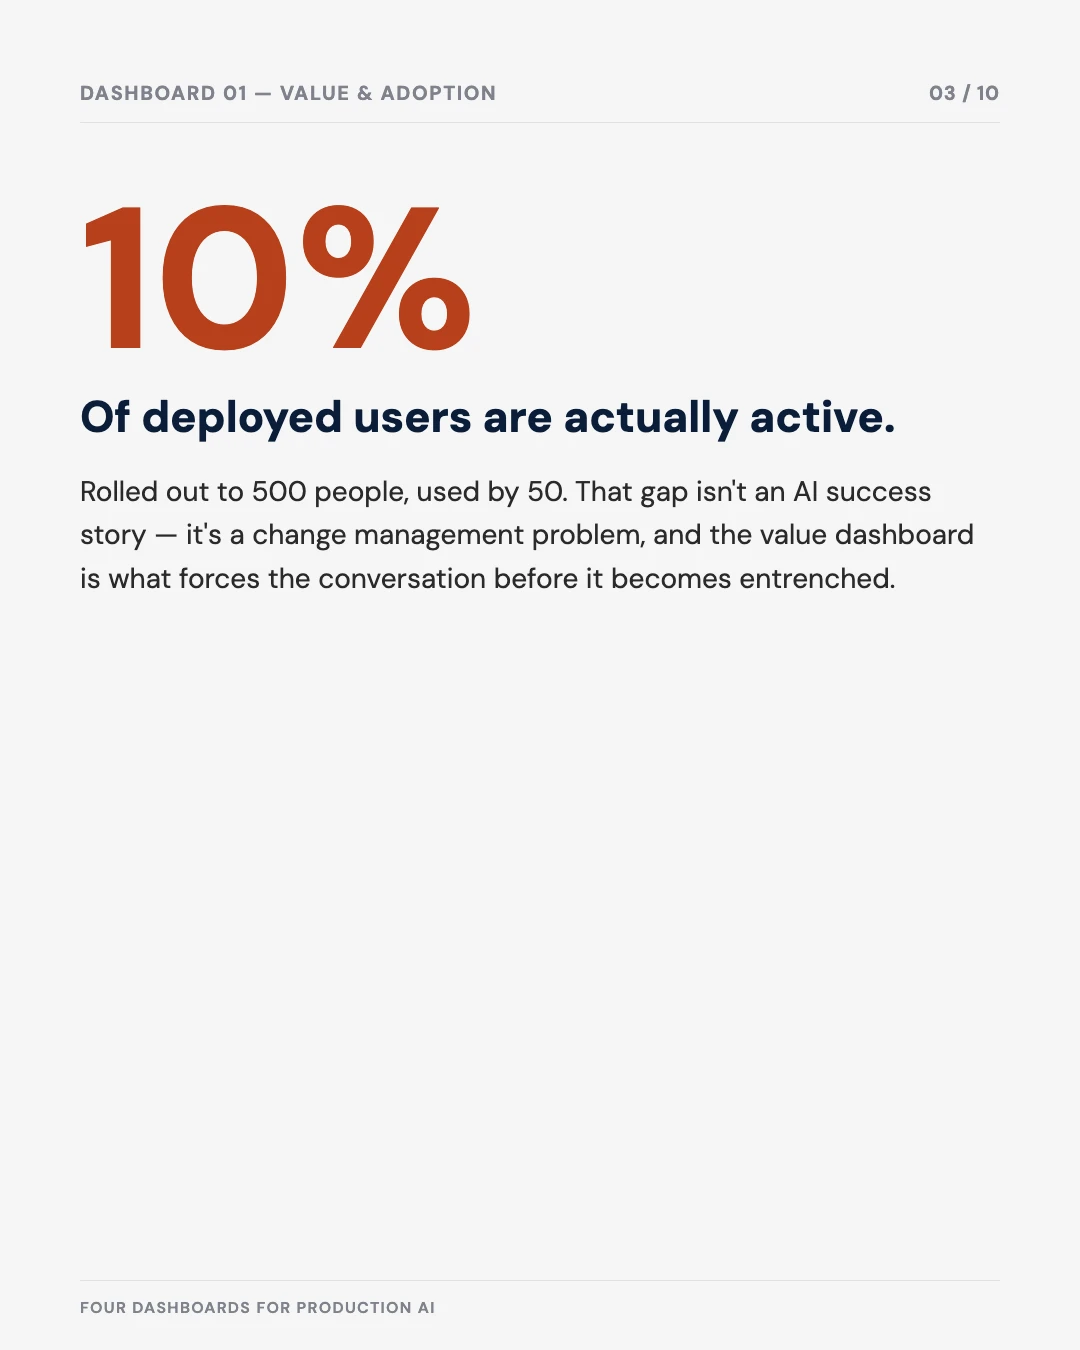
The adoption side of this dashboard tracks which business units are actually using AI systems and at what rate. Adoption data matters because it surfaces the gap between deployment and value capture. A system that has been deployed to five hundred users but is being actively used by fifty is not an AI success. It is a change management problem. The dashboard forces that conversation before the situation becomes entrenched.
A system that has been deployed to five hundred users but is being actively used by fifty is not an AI success. It is a change management problem.
Free tool
Enterprise AI Value & Adoption Dashboard
Track TCO, AI-influenced revenue, and adoption by business unit, the exact three inputs this dashboard is built around.
2. Model Performance & Health Dashboard
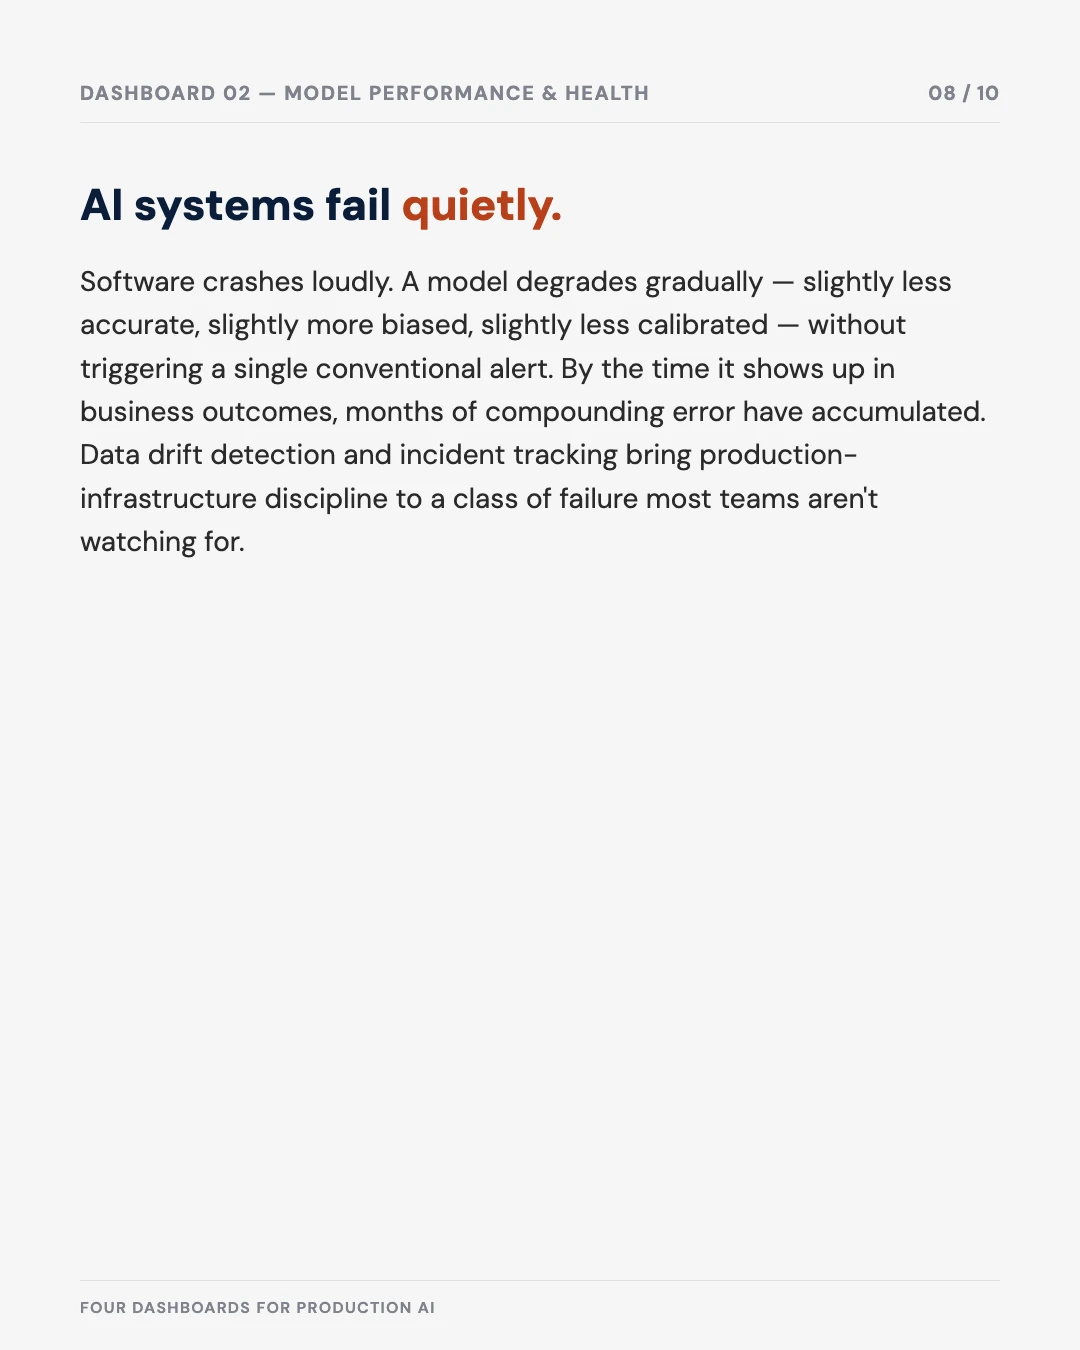
Software systems fail in ways that are usually visible: the application crashes, the service goes down, the error is returned. AI systems fail differently. A model can degrade gradually (producing outputs that are slightly less accurate, slightly more biased, slightly less calibrated to the current data distribution) without triggering any alert in a conventional monitoring system. By the time the degradation is visible in business outcomes, months of compounding error may have accumulated.
The Model Performance & Health Dashboard applies standard production infrastructure discipline to AI systems. Data drift detection identifies when the distribution of incoming data has shifted away from the training distribution, the most common precursor to model degradation. Latency and uptime metrics are tracked against defined service levels, treating AI applications with the same operational rigour as any other production service.
Incident tracking closes the accountability loop. Every model failure, every rollback, every emergency retraining event is logged with its business impact and resolution timeline. Over time, this creates the evidentiary record that allows you to identify patterns (particular data sources that cause recurring problems, particular business units where model performance is consistently weaker) and address root causes rather than symptoms.
Free tool
Model Performance & Health Dashboard
Track drift detection, latency, uptime, and rollback history for deployed models.
3. Trust, Risk & Governance (TRiG) Dashboard
The regulatory landscape for AI is evolving faster than most organisations’ internal governance structures. The EU AI Act, Singapore’s updated PDPA guidance, and sector-specific frameworks in financial services and healthcare are creating compliance obligations that did not exist two years ago. Quarterly compliance reviews are not adequate for this environment. By the time a problem surfaces in a quarterly cycle, it has already become a regulatory exposure.
The Trust, Risk & Governance Dashboard shifts compliance monitoring from periodic review to continuous assurance. Bias and fairness metrics are tracked across protected categories (gender, age, ethnicity) for any AI system used in consequential decisions. Automated monitoring catches distribution shifts that could indicate emerging bias before they manifest in harmful outputs.
Data lineage monitoring tracks the provenance of every input that flows through an AI system and every output that is generated. In a regulatory inquiry, the ability to reconstruct exactly what data was used to produce a specific AI-assisted decision is the difference between a manageable situation and a significant liability. Privacy protection metrics ensure that data handling obligations are being met continuously, not assumed.
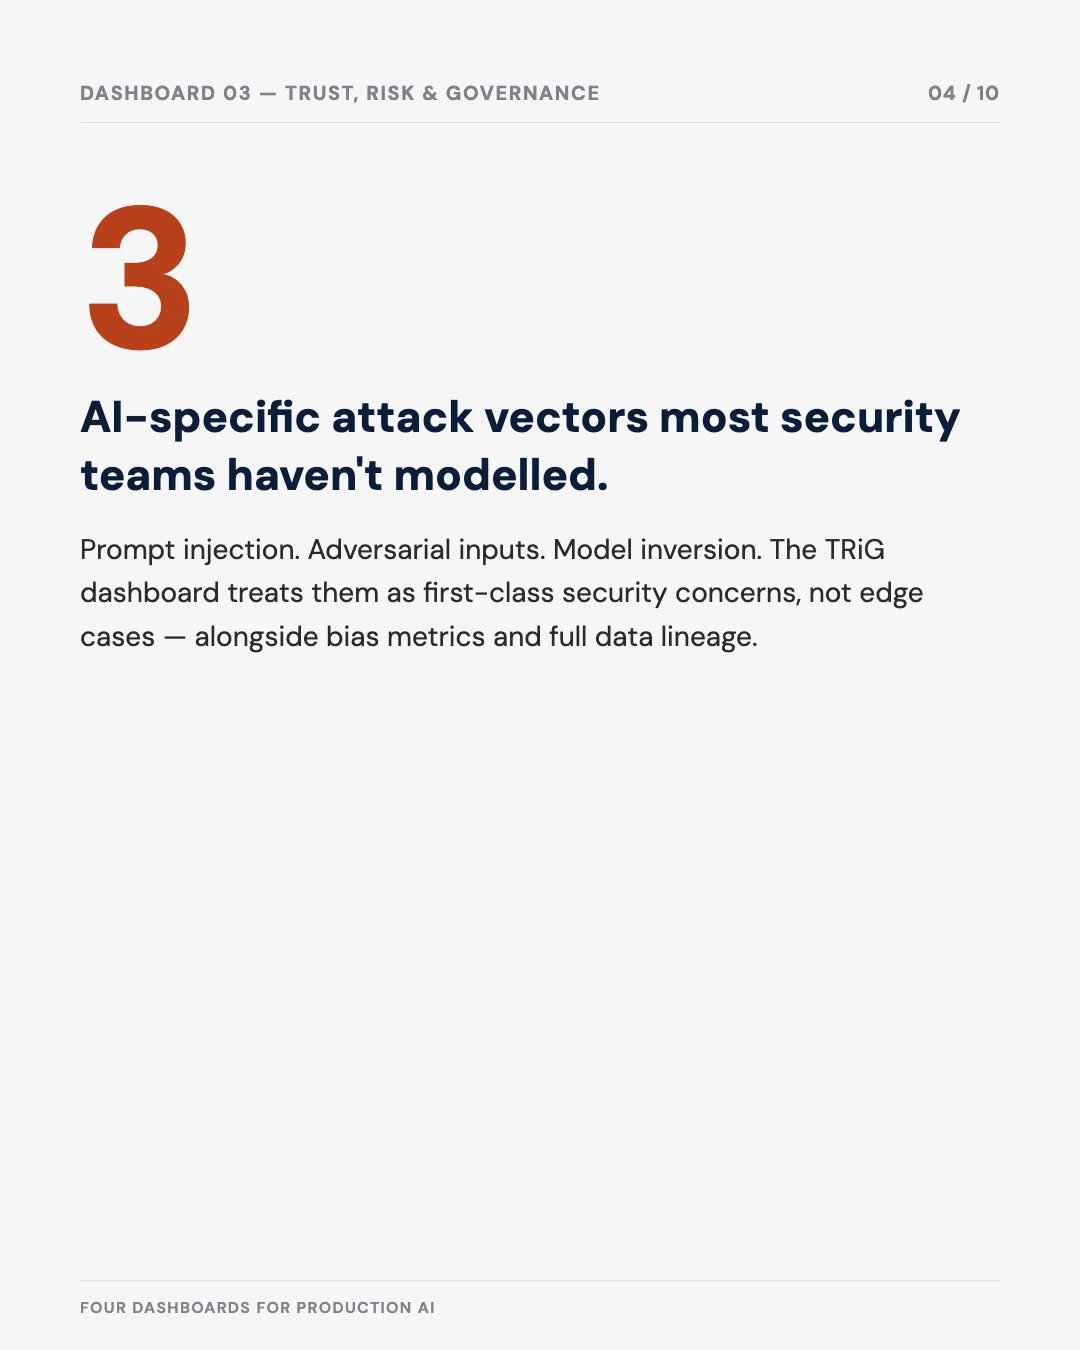
Security threat detection for AI systems is distinct from conventional network security. AI systems are vulnerable to prompt injection attacks, adversarial inputs designed to manipulate model outputs, and model inversion attacks that attempt to extract training data. The TRiG Dashboard treats AI-specific threat vectors as first-class security concerns rather than edge cases.
Free tool
AI Trust, Risk & Governance Dashboard
Monitor bias and fairness, trace data lineage, and surface AI-specific security threats before they become a regulatory exposure.
4. Human-AI Interaction & Decision Quality Dashboard
The fourth dashboard addresses the question that the other three do not: what is happening to human decision-making quality as AI systems become more prevalent? This matters because the risk that receives the least attention in AI governance is not model failure. It is the gradual erosion of human judgement that occurs when AI outputs are accepted without critical evaluation.
Decision acceptance rates track how often human operators accept AI recommendations without modification. A high acceptance rate looks like a success metric until you examine what it actually indicates: that humans have stopped applying their own judgement, which means the AI system’s errors are propagating directly into decisions without any human checkpoint. A well-designed AI governance programme targets decision acceptance rates that reflect genuine collaboration rather than passive automation.
User sentiment feedback provides the ground truth on workforce experience that adoption metrics miss. A business unit with high adoption but low satisfaction is one where AI use has become mandatory rather than valuable: a risk to both performance and retention. The dashboard surfaces this signal before it becomes a talent problem.
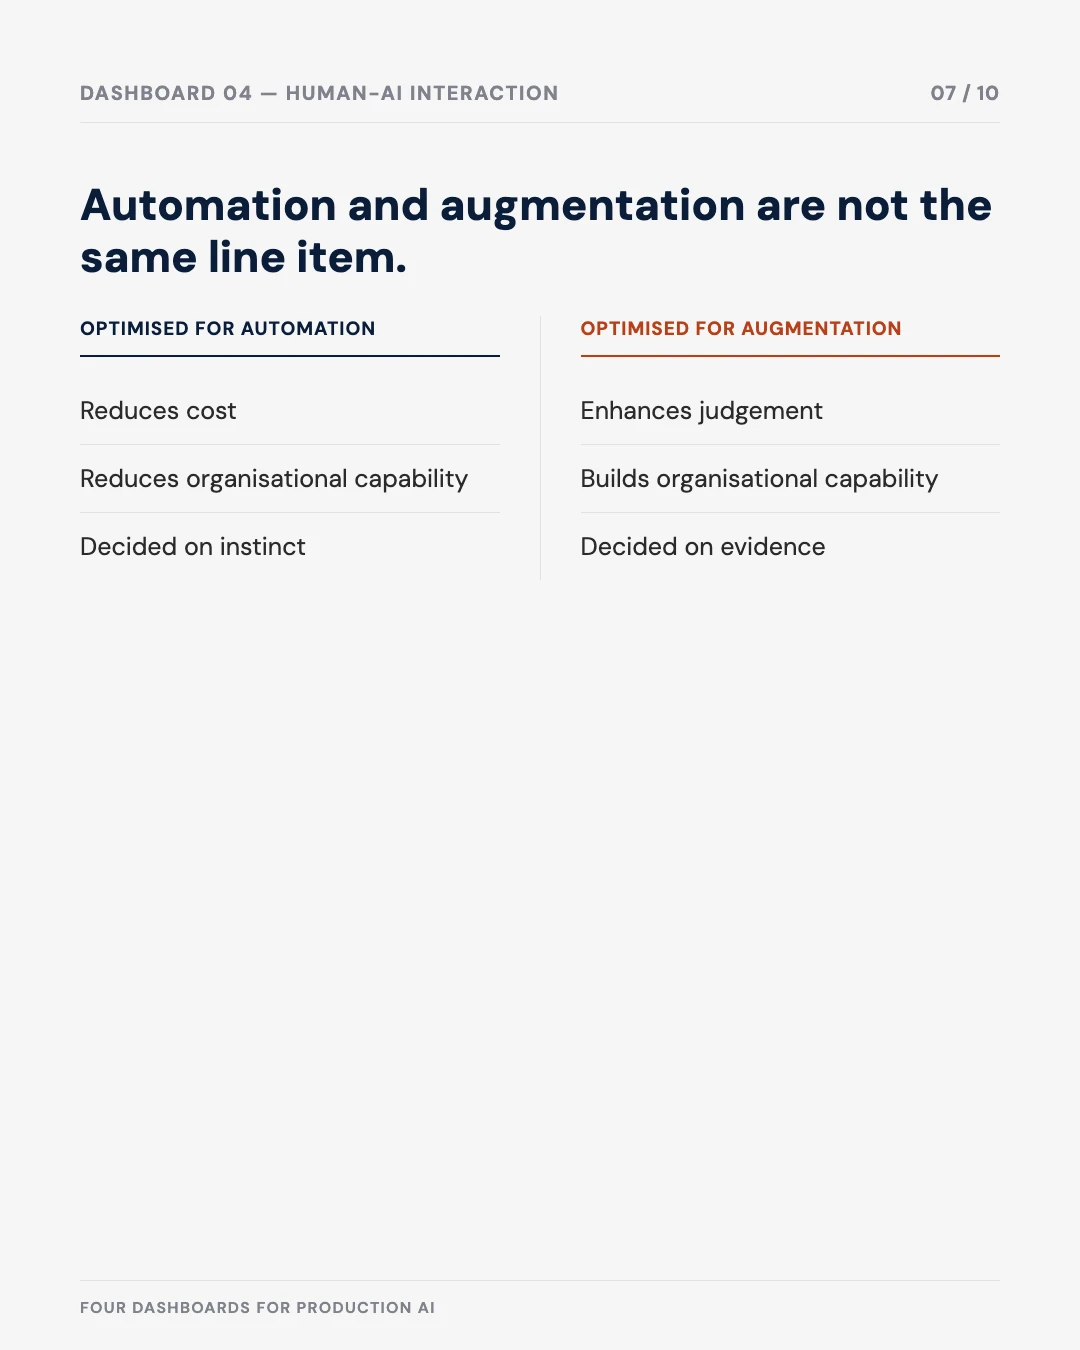
The automation-versus-augmentation ratio is perhaps the most strategically important metric on this dashboard. It tracks what proportion of AI value is coming from replacing human effort versus enhancing human capability. Organisations that optimise purely for automation tend to reduce costs while simultaneously reducing the organisational capabilities that make them competitive. The ratio provides the data to have an informed conversation about where AI should replace and where it should augment, a conversation that most organisations are having on instinct rather than evidence.
Free tool
Human-AI Interaction & Decision Quality
Benchmark decision acceptance rates and automation bias against the centaur model this section describes.
Operating the four dashboards
The dashboards are not independent instruments. They are designed to be read together because the important signals often sit at the intersections.
A high ROI figure on the value dashboard that coincides with a deteriorating automation-versus-augmentation ratio on the interaction dashboard should prompt scrutiny: is the return coming from genuine efficiency improvement, or from a reduction in decision quality that has not yet manifested in visible outcomes? A clean governance dashboard reading alongside declining model health metrics suggests that compliance monitoring is catching up to a performance problem that has already emerged.
The Chief AI Officer who can read across these four dashboards is in a fundamentally different position from one operating on intuition and anecdote.
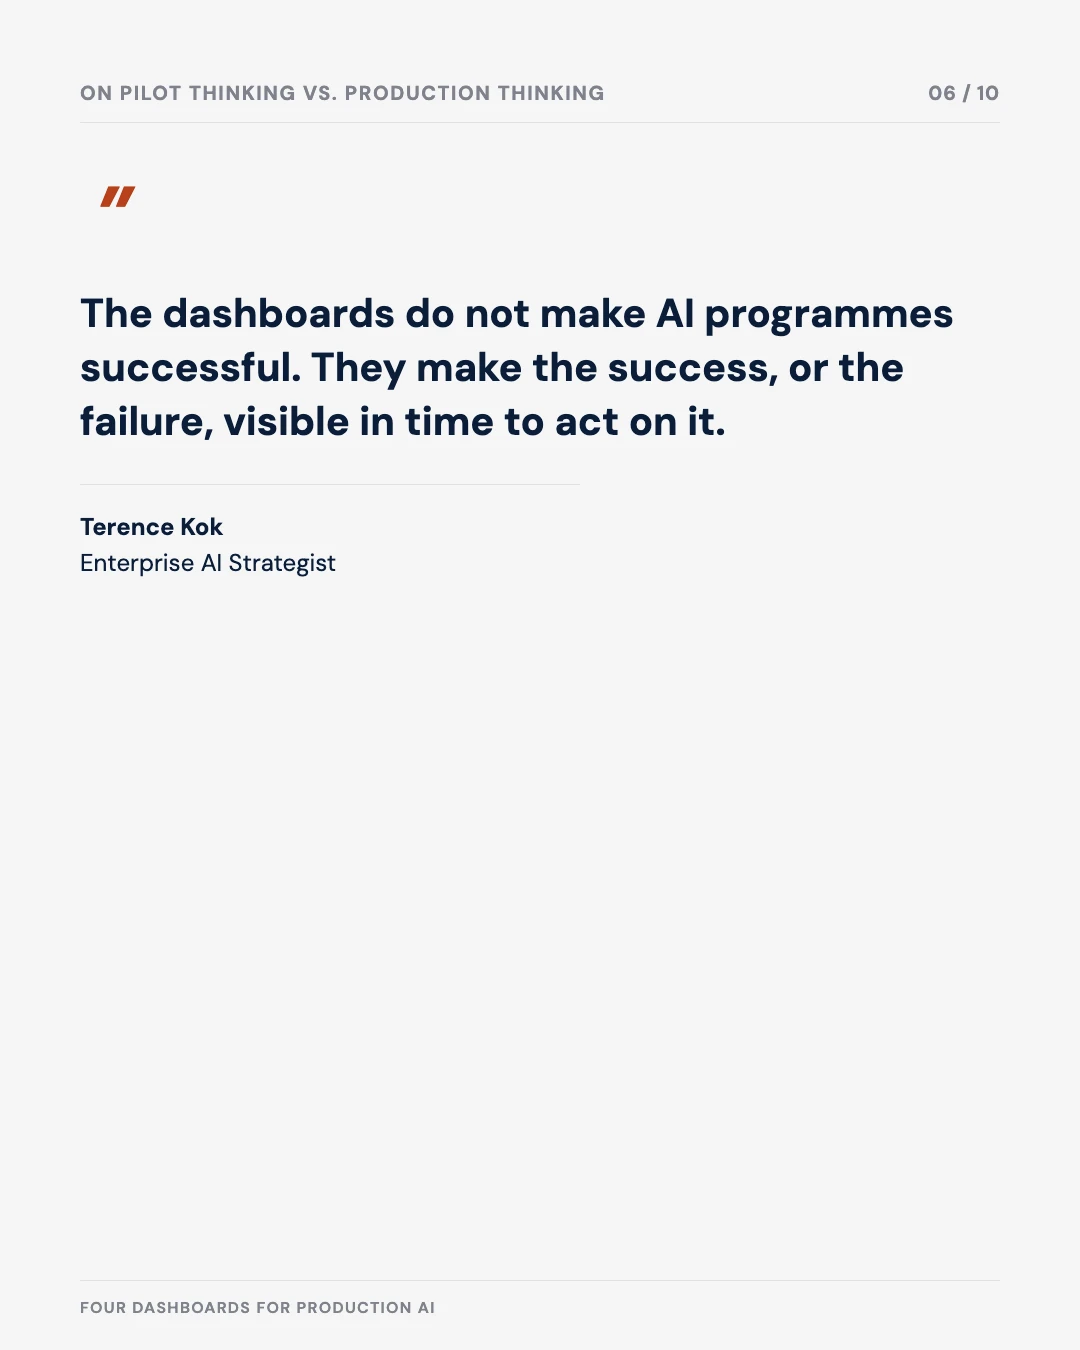
The dashboards do not make AI programmes successful. They make the success, or the failure, visible in time to act on it.
That is the shift from pilot thinking to production thinking. And it is the shift that separates AI leadership from AI cheerleading.
All four dashboards are available as interactive tools in the Resources section.
Was this useful?