
Executive Summary
The price of a token at a given level of performance has fallen by between 9 and 900 times a year, depending on the task, and the AI bill keeps rising anyway. Three things grow faster than prices fall: the number of calls, the tokens each task uses, and the price of the newer models teams move to. An invoice for the whole organisation cannot show which of these is happening, or whether any use case is worth what it costs. The fix is to account for AI the way finance already accounts for other variable costs. Every model call carries the ID of the use case that made it, the same ID the benefits register uses. Each use case gets a cost-per-outcome line that covers everything it takes to run it, of which the model tokens are often the smaller part. A monthly review then needs three numbers: cost per outcome against benefit per outcome, a bridge that splits the change in the bill into volume, consumption and rate, and the share of AI spend that nobody has tagged.
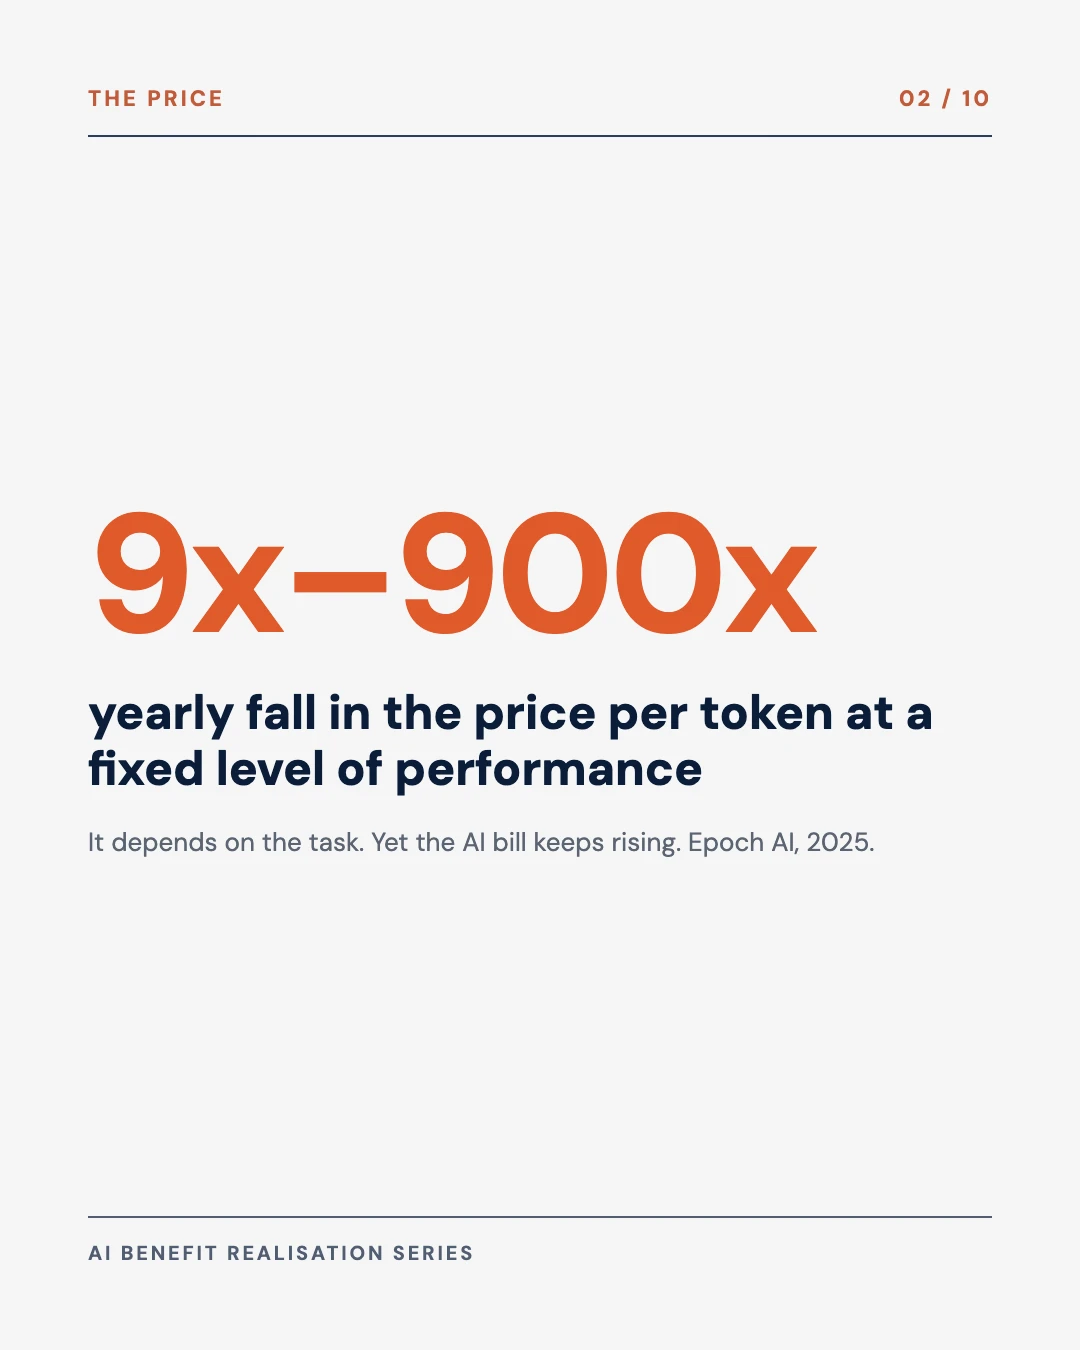
9x–900x
yearly fall in the price per token at a fixed level of performance, depending on the task, Epoch AI, 2025
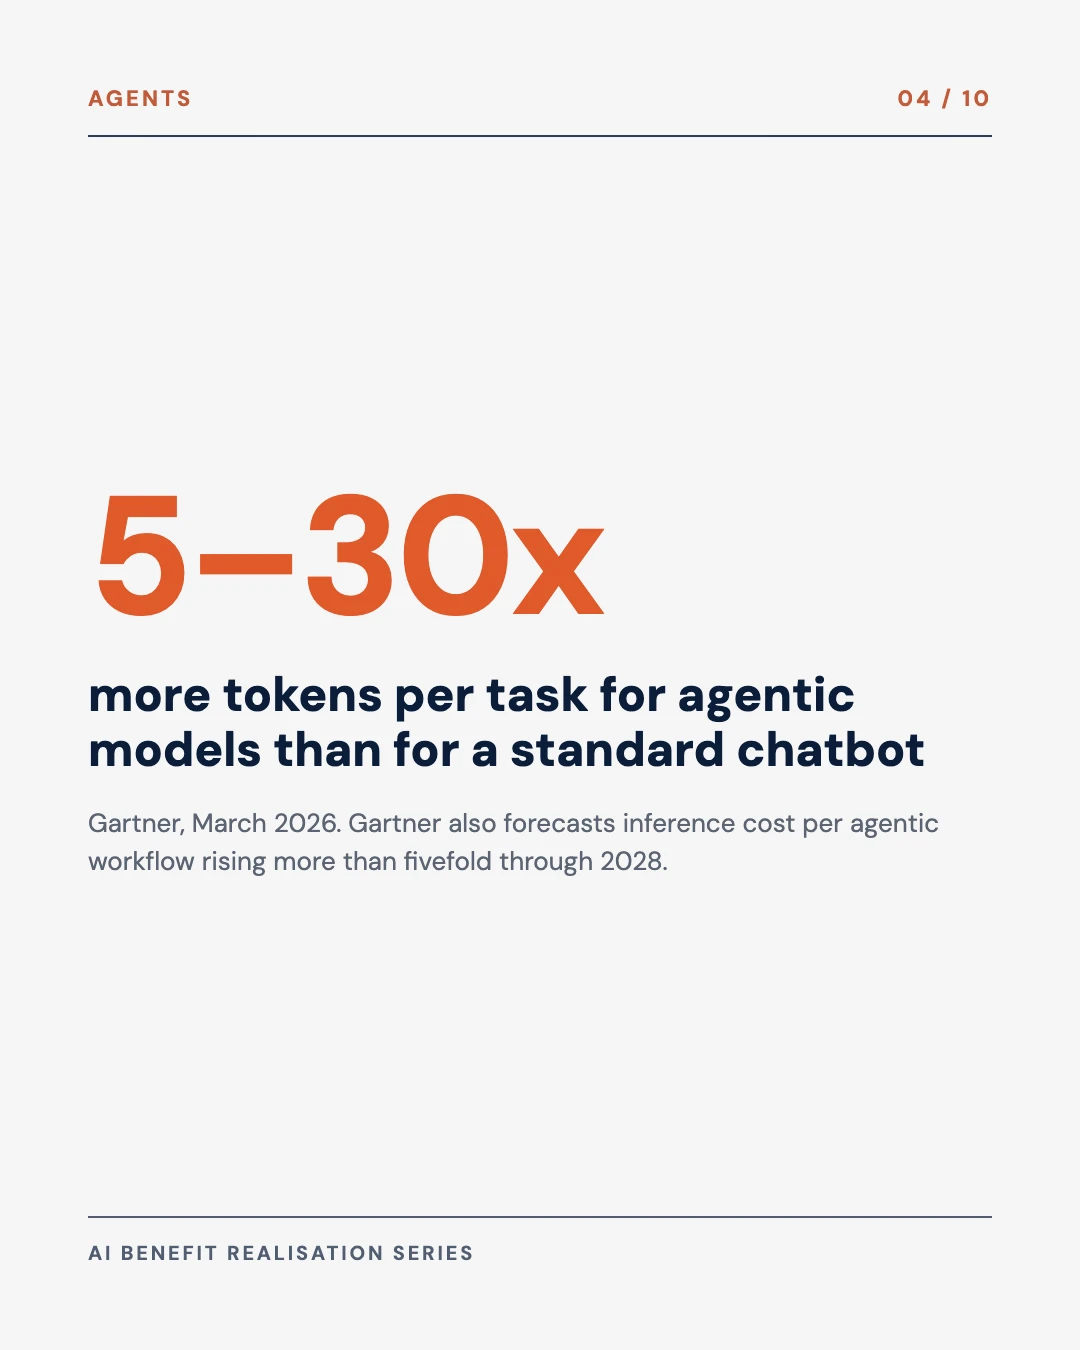
5–30x
more tokens per task for agentic models than for a standard chatbot, Gartner, March 2026
98%
of FinOps practitioners now manage AI spend, up from 31% in 2024, State of FinOps 2026
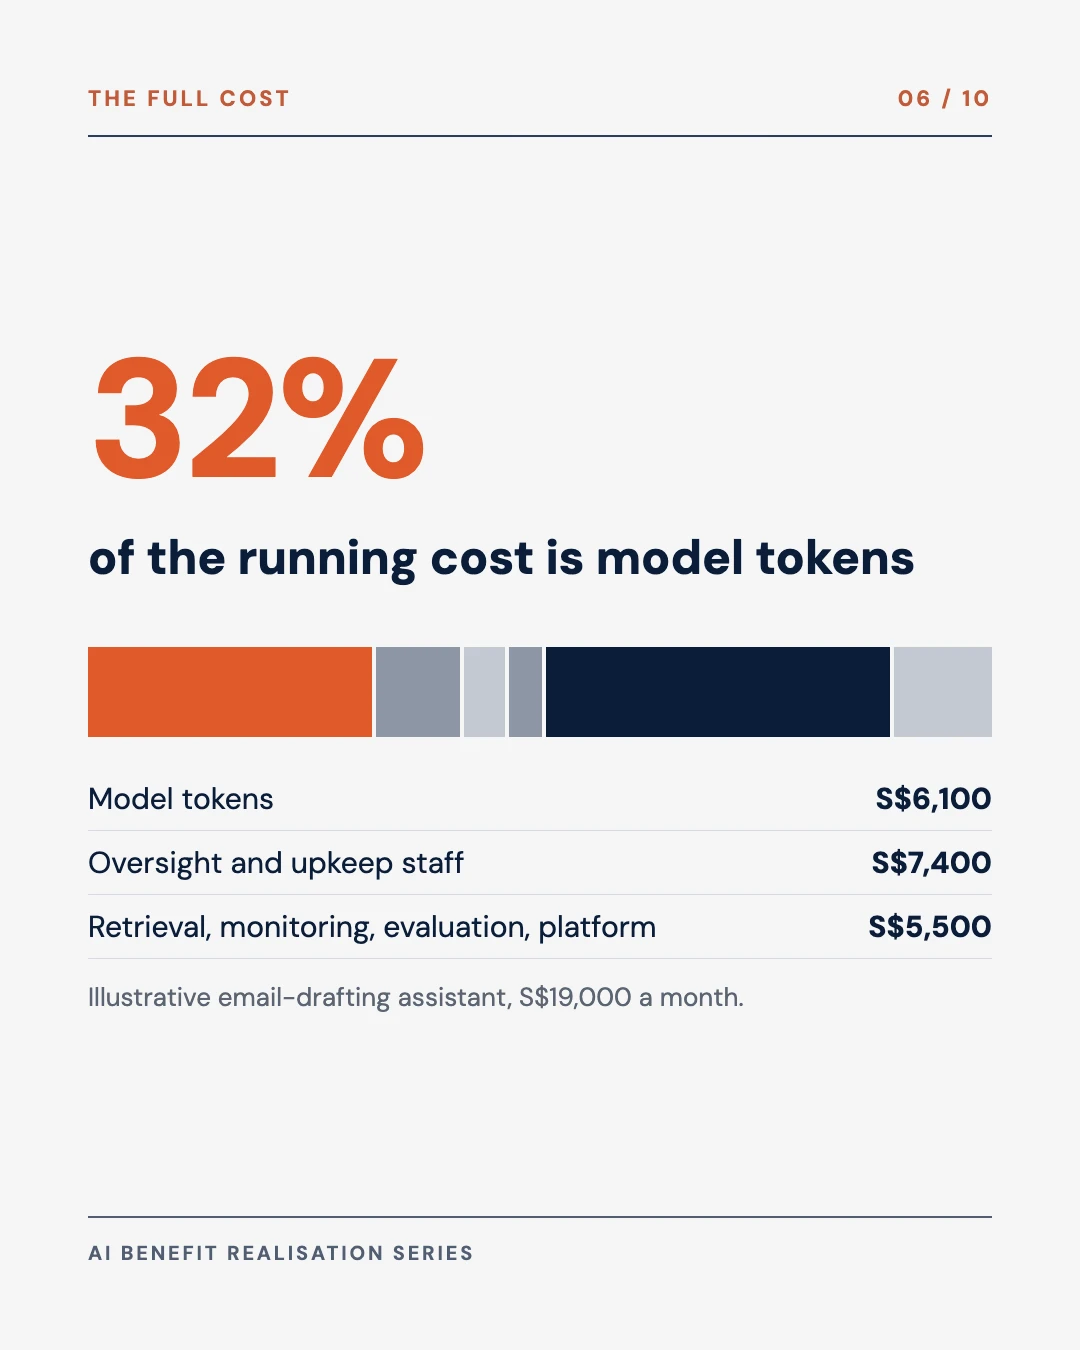
32%
of the monthly running cost in our worked example is model tokens; the rest is retrieval, monitoring, people and platform
Core conclusions
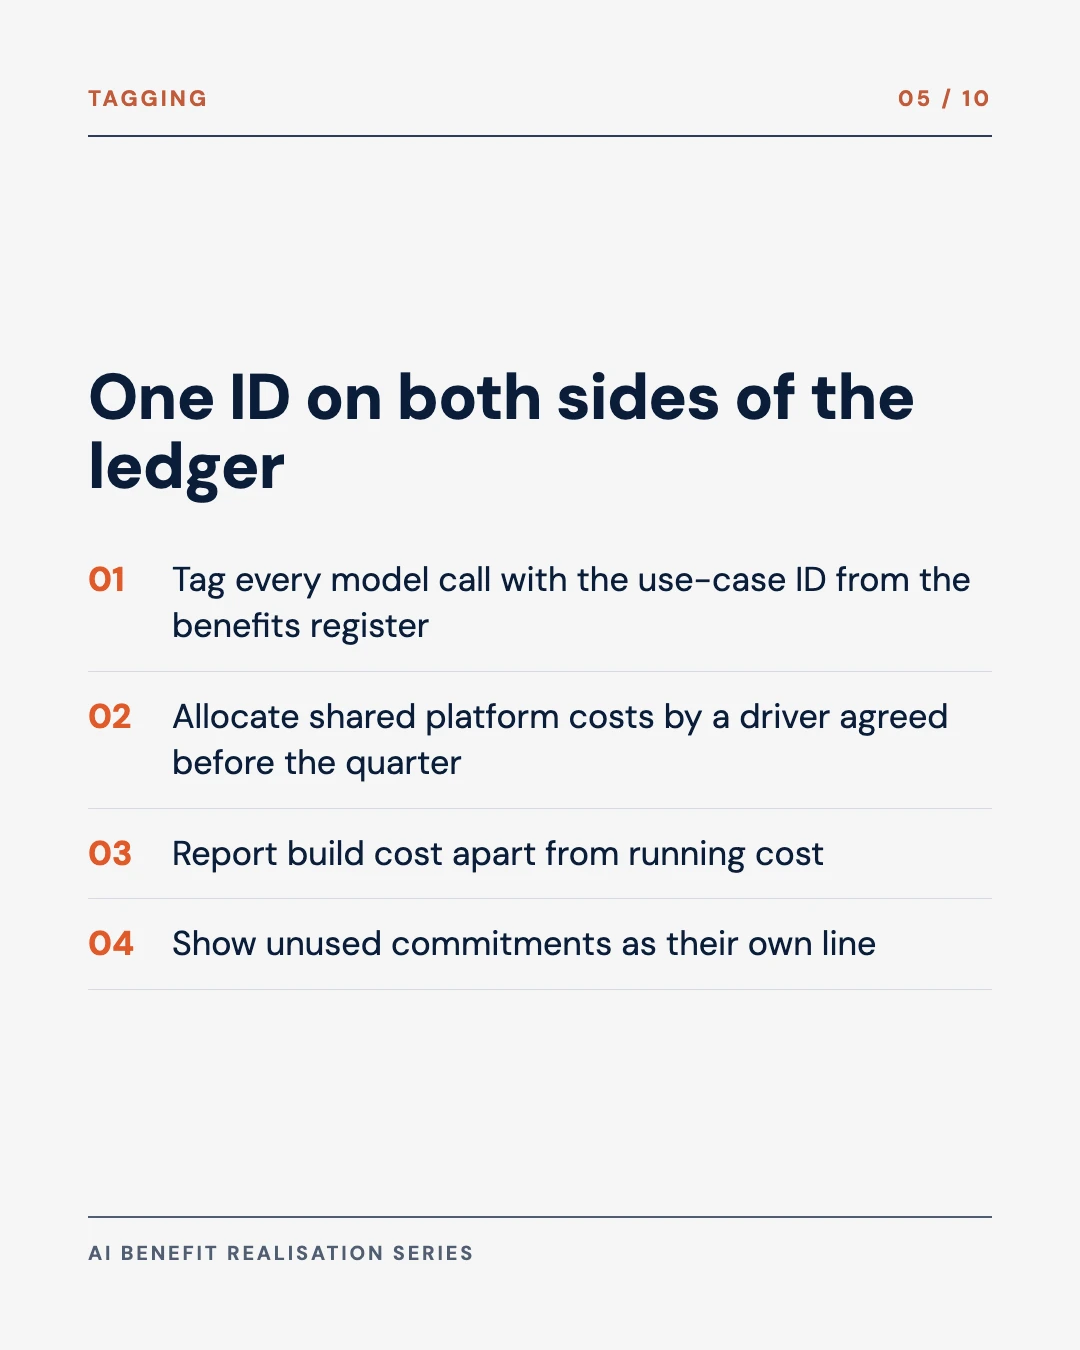
- Tag every model call with the use-case ID from the benefits register, so that cost and benefit share an owner and a key. Allocate shared platform costs by a driver agreed before the quarter starts.
- Divide the full running cost of a use case by its business outcomes, such as cases resolved or letters sent, rather than by calls or tokens. Failed calls, retries and evaluation runs stay in the cost.
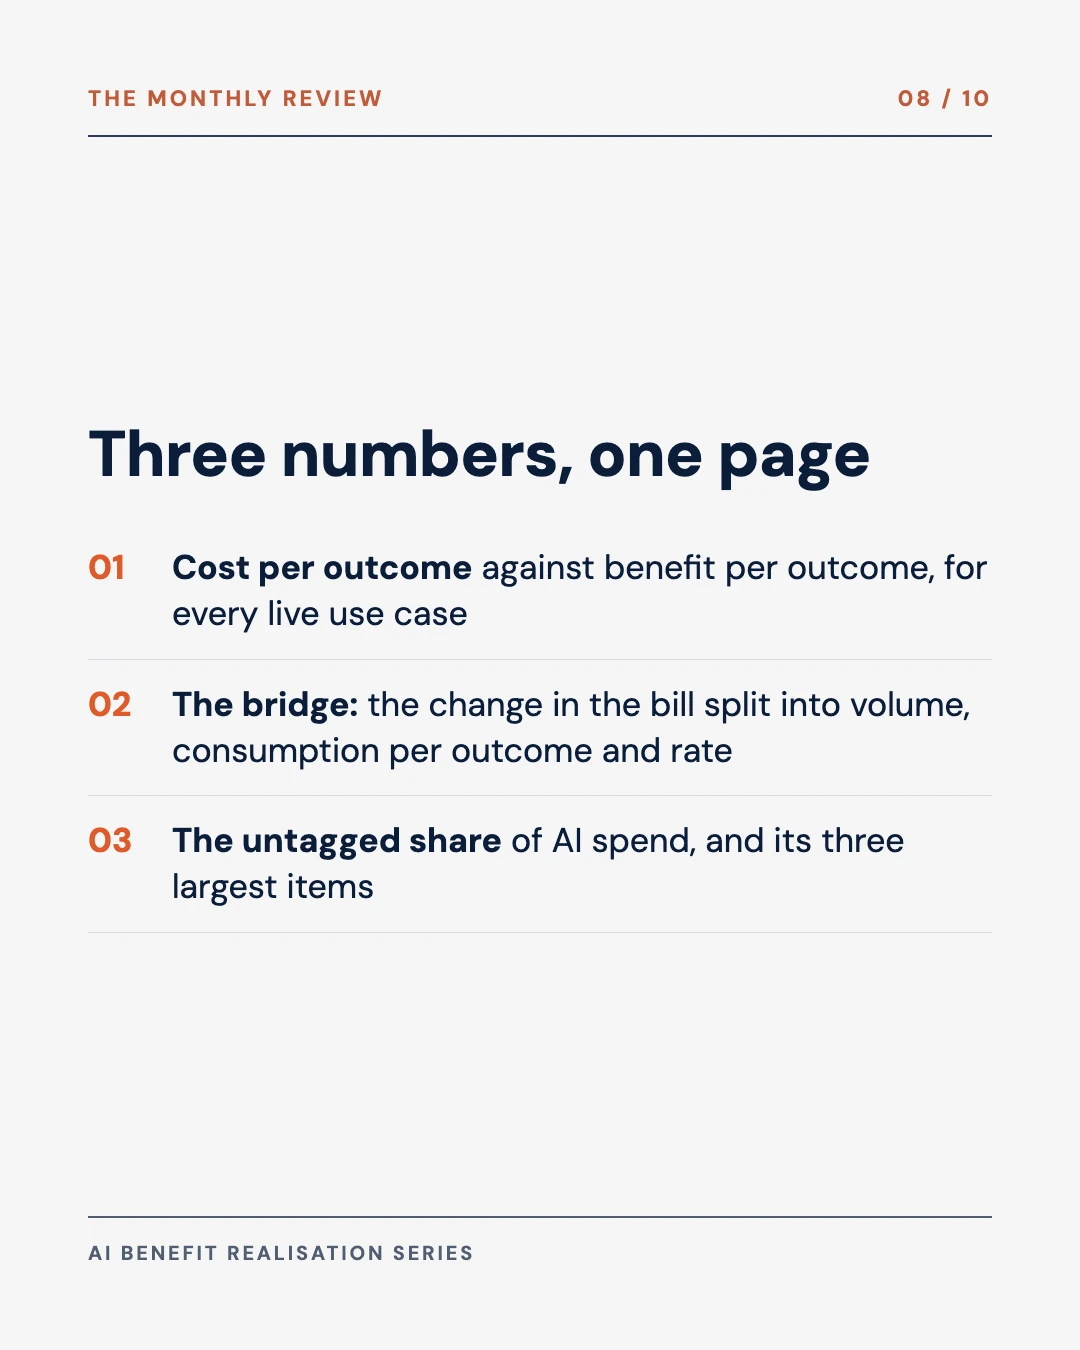
- Review three numbers each month: cost per outcome against benefit per outcome, the bridge from last month’s bill to this month’s, and the share of AI spend still untagged.
The argument, in ten slides
Save it, or send it to whoever reviews your AI spend each month.
This is the fourth part of the series Christina and I are writing on AI benefit realisation. Part 1 set out the controls the CFO and the Chief AI Officer sign together. Part 2 covered the baseline and part 3 the methods that separate the AI’s effect from everything else. Those three parts measure the benefit. This part measures the cost on the same terms: per use case, per outcome, and reviewed each month. Christina brings the finance view again: how the cost line is built, how a change in the bill is explained, and what a finance team should ask for before the next invoice arrives.
Why the bill rises while prices fall
Epoch AI tracked the cheapest model that reaches a given score on a benchmark and found that the price of that level of performance fell by between 9 and 900 times a year, depending on the task. To match GPT-4 on a set of PhD-level science questions, the price fell by about 40 times a year. The finding is real, and it is often quoted as a reason AI costs will take care of themselves.
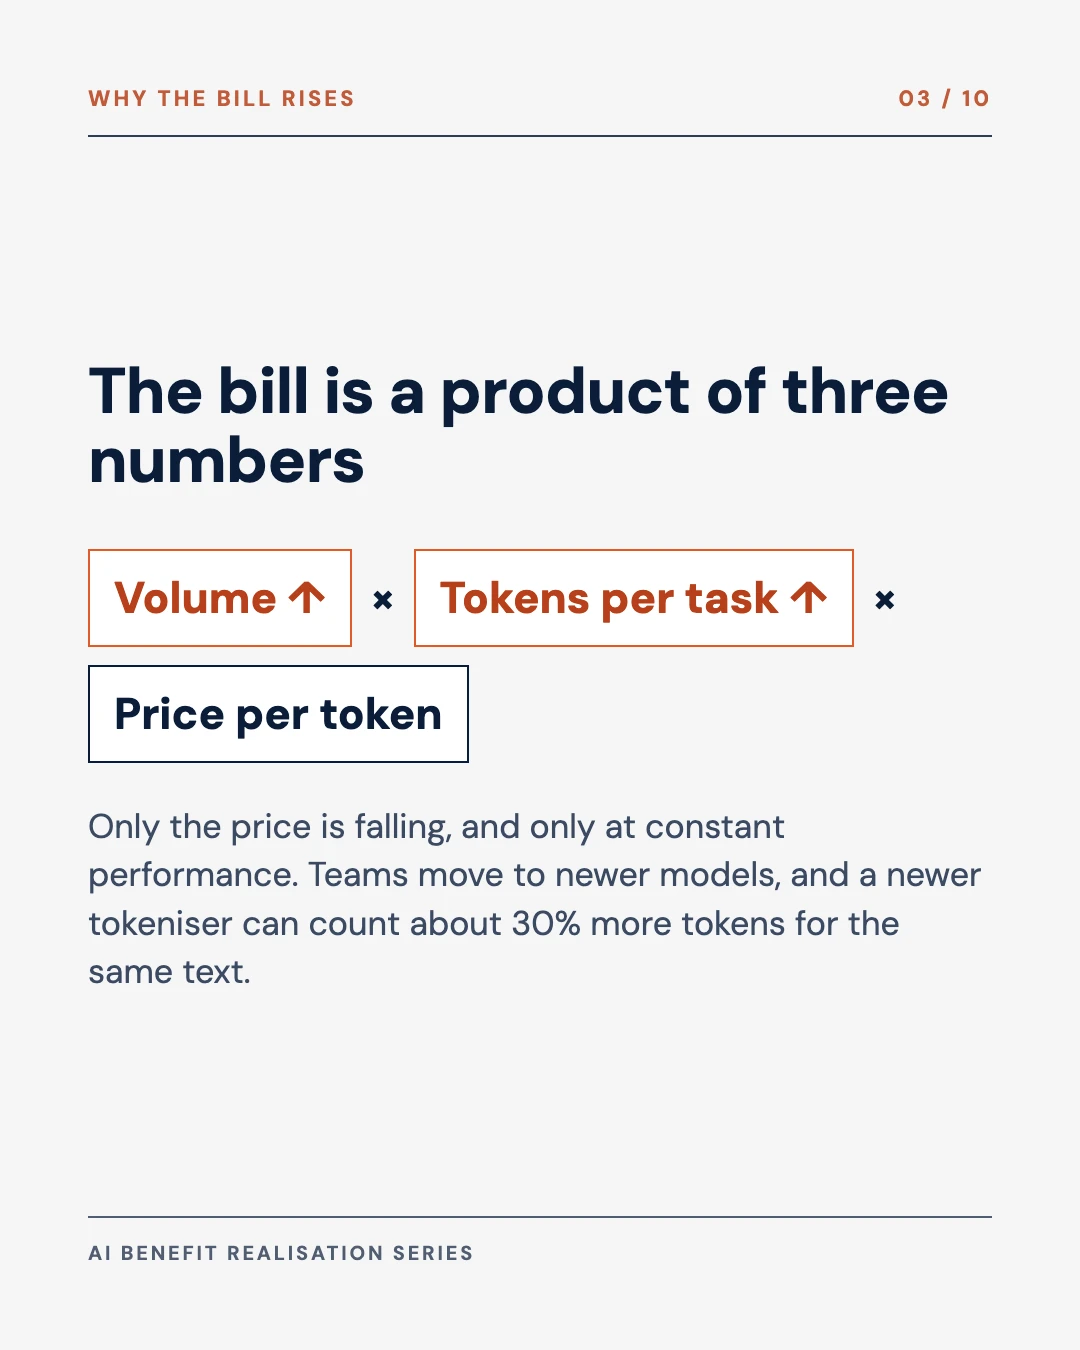
They do not, because the bill is a product of three numbers, and only one of them is falling.
Volume. More people use the tools, more use cases go live, and each one makes more calls as it becomes part of the daily work.
Tokens per task. A drafting assistant that reads a few retrieved documents before answering uses more input than one that answers from the prompt alone. A reasoning model writes out its working before it answers, and the working is billed. An agent calls the model many times for one task. Gartner estimated in March 2026 that agentic models need 5 to 30 times more tokens per task than a standard chatbot, and in a later 2026 release forecast that inference cost per agentic workflow will rise more than fivefold through 2028. Gartner calls this the inference paradox: cheaper units of AI lead to higher total spending.
Price per token. Epoch’s figures hold performance constant. Enterprises rarely do. They move to the newest model, which sells at a higher price than the older model whose price has fallen. A change of model can also change the count. Anthropic’s pricing documentation notes that its newer tokeniser produces about 30 per cent more tokens for the same text, so the same email can cost more at the same list price per token.
Finance teams already know this shape. A falling unit price says little about the bill when volume and mix are moving, and nobody would accept “the price per kilowatt-hour fell” as an explanation of a rising electricity bill. AI spend needs the same treatment: a cost line per use case, and a monthly explanation of the change.
One ID on both sides of the ledger
Part 1 gave every AI use case an entry in a single benefits register, with an owner. The cost side should use the same ID. When the benefit and the cost of the same use case carry the same key, working out the unit margin is a simple join between two tables.
Four rules make the tagging reliable.
Tag at the call. Every model call carries the use-case ID, set by the application that makes the call. The simplest way is to route all model traffic through one internal gateway that rejects calls without an ID and records the tokens, model and cost of each. Where the provider supports it, a separate API key or project per use case gives a second check against the invoice.
Allocate shared costs by a declared driver. A shared gateway, a vector database used by five use cases and the platform team’s time cannot be tagged to one call. Allocate them by requests or by tokens, choose the driver before the quarter starts, and do not change it when a use case’s numbers look poor.
Keep build and run apart. Development, testing and evaluation runs are tagged to the use case and reported as build cost, separately from the running cost of the live service. Mixing them makes a use case look expensive in its first quarter and cheap afterwards, whatever is happening to its real running cost.
Show unused commitments. A committed-spend contract or reserved capacity behaves like a fixed cost. The part that use cases consumed is allocated to them. The unused part is reported as its own platform line, so that a purchasing decision does not hide inside the use cases’ unit costs.
The billing data also needs a common shape, because most organisations buy from more than one provider. The FinOps Foundation’s FOCUS specification sets a standard format for cloud and software billing data, and the Foundation has a workstream on AI token charges. Asking providers and internal platforms for FOCUS-aligned exports saves the finance team from reconciling four invoice formats each month.
Building the cost-per-outcome line
A cost-per-outcome line has a numerator and a denominator, and both are easy to get wrong.
The numerator is the full running cost of the use case for the month. Model tokens are only one part of it. The worked example below is a drafting assistant that prepares replies to customer emails in a contact centre, the same kind of use case part 3 used.
| Cost line | What it covers | Monthly cost (S$) |
|---|---|---|
| Model tokens | Input, output and cached tokens for every call, including failed calls and retries | 6,100 |
| Retrieval and compute | Vector database, search over the knowledge base, orchestration servers | 1,800 |
| Monitoring and guardrails | Logging, content filters, tracing and alerting tools | 900 |
| Evaluation runs | Scheduled tests of answer quality against a fixed test set | 700 |
| Oversight and upkeep | Quality reviewers sampling AI drafts; staff maintaining prompts and the knowledge base | 7,400 |
| Shared platform | Share of the AI gateway and platform team, allocated by requests | 2,100 |
| Total | 19,000 |
Illustrative worked example built for this post. The proportions vary widely between use cases; the point is that each line is counted.
One use case's monthly running cost, line by line
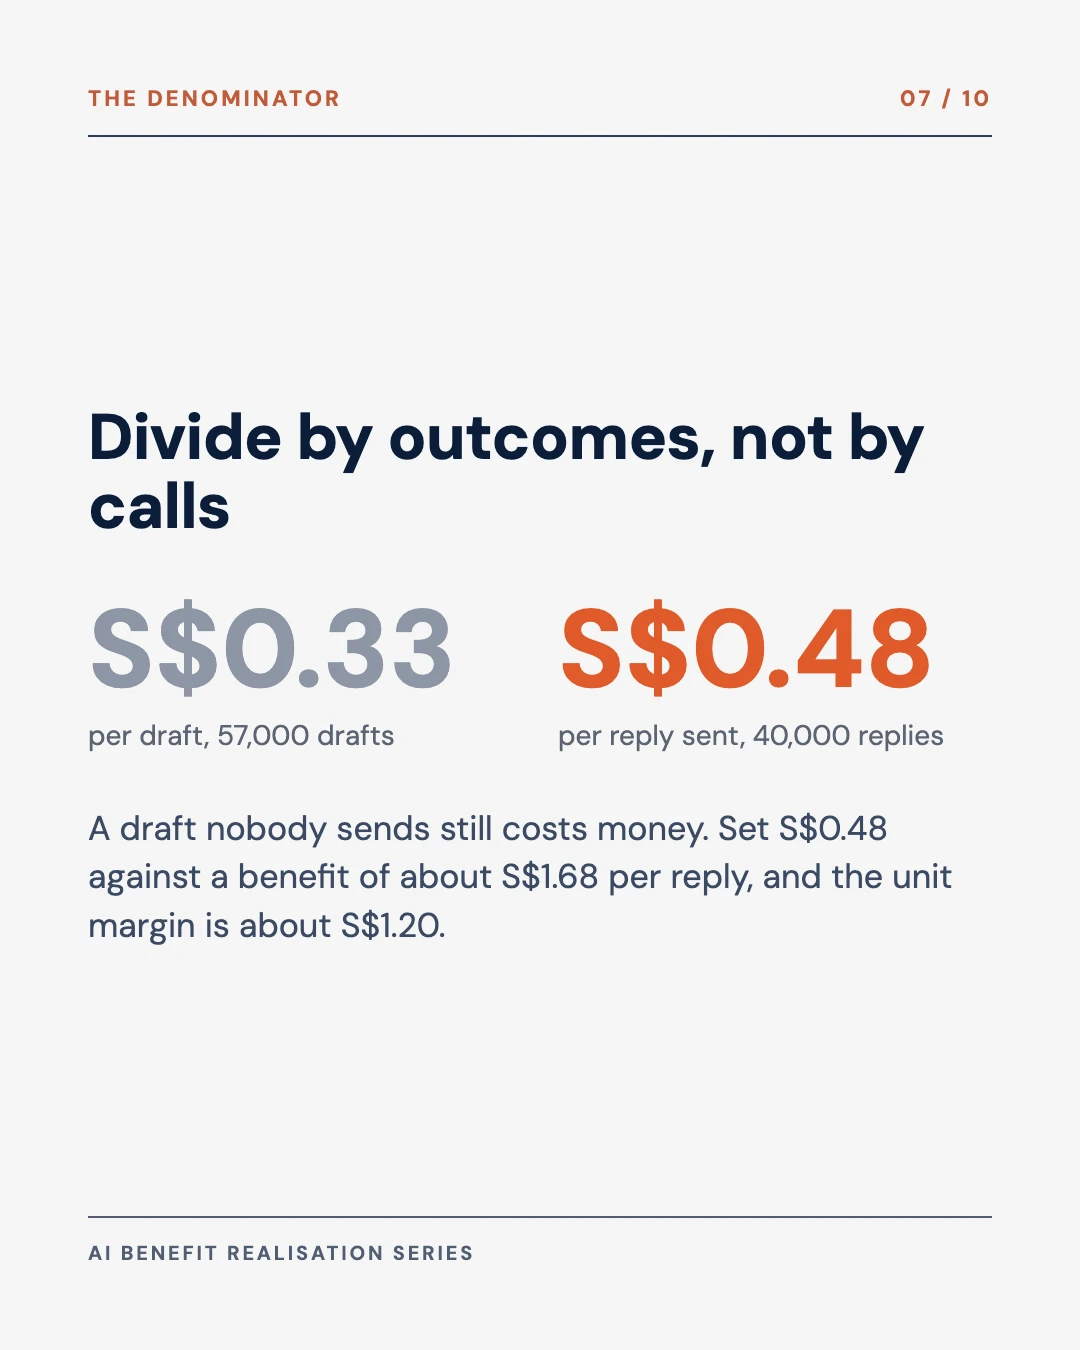
S$0.33
per draft, 57,000 drafts
S$0.48
per reply sent, 40,000 replies: the figure to set against the benefit
Illustrative worked example for an email-drafting assistant in a contact centre, built for this post. Total S$19,000 a month.
In this example the tokens are 32 per cent of the cost. The largest line is people: the reviewers who check a sample of drafts and the staff who keep the prompts and the knowledge base current. That line belongs here only when the work sits outside the process whose benefit was measured. If agents’ own review time is already inside the handling-time figure that part 3 measured, it is part of the benefit calculation and should not be counted again as a cost.
The denominator is the business outcome the use case exists to produce, which here is a reply sent to a customer. The assistant produced 57,000 drafts in the month and 40,000 of them were sent after editing. Divided by drafts, the cost is S$0.33. Divided by replies sent, it is S$0.48. The first figure flatters the use case, because a draft that nobody sends still costs money. The outcome should be the unit in which the benefit was measured, so that the two lines can be set against each other.
That comparison is the unit margin. If part 3’s comparison group showed that each reply sent saves 2.4 minutes of agent time, and a minute of agent time costs S$0.70 fully loaded, the benefit per outcome is about S$1.68. Against a cost of S$0.48, the use case earns about S$1.20 per reply. A use case whose cost per outcome is above its benefit per outcome is losing money on every transaction, however impressive the total benefit looks.
Explaining the change each month
The second number is a bridge from last month’s bill to this month’s. Finance teams build price, volume and mix variances for every other cost they manage, and the same split works for AI.
From last month's AI bill to this month's
S$0.44
per reply last month
S$0.48
per reply this month: the question for the owner is whether wider retrieval earned it
Illustrative worked example built for this post. Volume is priced at last month's cost per reply; consumption and rate split the change in cost per reply.
In the example, the bill rose from S$14,000 to S$19,000. Replies sent rose from 32,000 to 40,000. At last month’s cost of about S$0.44 per reply, that volume alone adds S$3,500, and that part is good news: the use case is being used. Consumption per reply rose and added S$3,000, because the team widened the retrieval to pull in more documents per draft. The price per token fell and removed S$1,500, partly because the team turned on prompt caching. The net result is a cost per reply that rose from S$0.44 to S$0.48.
Without the bridge, the review sees a 36 per cent rise in the bill and asks the wrong question. With it, the question is whether the wider retrieval improved the replies enough to justify S$3,000 a month. That is a question the use-case owner can answer, from the quality measures the evaluation runs already produce.
The share nobody has tagged
The third number is the share of AI spend that has no use-case ID. It covers calls made with keys that predate the gateway, staff experimenting with personal accounts expensed to a cost centre, AI features bundled into software subscriptions, and pilots that skipped the register. The State of FinOps 2026 survey found that 98 per cent of FinOps practitioners now manage AI spend, up from 31 per cent in 2024, and that allocating AI costs to business units is one of their main difficulties.
The untagged share should fall every month. In our experience a first measurement often shows a large share untagged, and a reasonable aim is to bring it below a tenth within two quarters. Each untagged line has two possible outcomes: it is tagged to an existing use case, or it is a use case nobody registered, which goes into the register with an owner or is switched off.
Levers that lower cost per outcome
Once cost is visible per outcome, the levers are mostly engineering choices, and each one shows up in the bridge.
| Lever | What it does | Published price effect |
|---|---|---|
| Route by difficulty | Send simple tasks to a smaller model and keep the large model for hard ones | Gartner recommends tiering and routing as the main defence against the inference paradox |
| Prompt caching | Reuse a long, repeated prompt prefix, such as instructions and policy text | Anthropic charges a cache read at 10 per cent of the base input price on most current models |
| Batch processing | Run work that can wait, such as overnight summaries, through a batch interface | Anthropic’s Batch API is 50 per cent cheaper on input and output |
| Limit output length | Ask for shorter answers and cap the maximum | Output tokens cost five times input tokens on Anthropic’s current models |
| Cap agent steps | Set a maximum number of model calls per task and stop loops | Removes the long tail of runaway tasks |
Prices from Anthropic’s published pricing documentation, read in October 2026; other providers offer similar discounts on different terms. Gartner’s recommendation is from its 2026 release on the inference paradox.
Some cost choices are governance decisions. Anthropic, for example, charges 1.1 times the standard price when inference is restricted to the United States. A data residency requirement may be the right call, and its cost belongs in the use case’s line, where the person who asked for it can see it.
The monthly AI cost review
The review takes one page, sorted by use case, with three numbers.
- Cost per outcome against benefit per outcome. One row per live use case, with last month’s figures and the trend. A use case whose unit margin turns negative is flagged for its next stage-gate.
- The bridge. The change in total AI spend split into volume, consumption per outcome and rate, with one line of explanation from the owner for any consumption change over 10 per cent.
- The untagged share. The percentage of AI spend with no use-case ID, and the three largest untagged items.
Christina’s view from the finance side adds two habits. Provider invoices often arrive after the month closes while the gateway records usage daily, so accrue AI costs from the gateway logs at month end rather than waiting for the invoice. And set budgets and alerts on cost per outcome as well as on total spend. A rising total with a steady cost per outcome is growth. A rising cost per outcome is a problem with an owner.
What to do before the next invoice
- Use the register ID as the cost tag. Every model call carries the use-case ID from the benefits register, and the gateway rejects calls without one.
- Agree the allocation driver. Choose requests or tokens for shared platform costs before the quarter starts, and keep it for the year.
- Define the outcome per use case. It is the same unit the benefit is measured in, and it is written into the pilot charter next to the attribution method from part 3.
- Count the full cost. Retrieval, monitoring, evaluation, oversight staff and the platform share sit in the line with the tokens. Build cost is reported separately.
- Start the review this month. Three numbers, one page, owners present. The first version will be rough, and the untagged share will show where to work next.
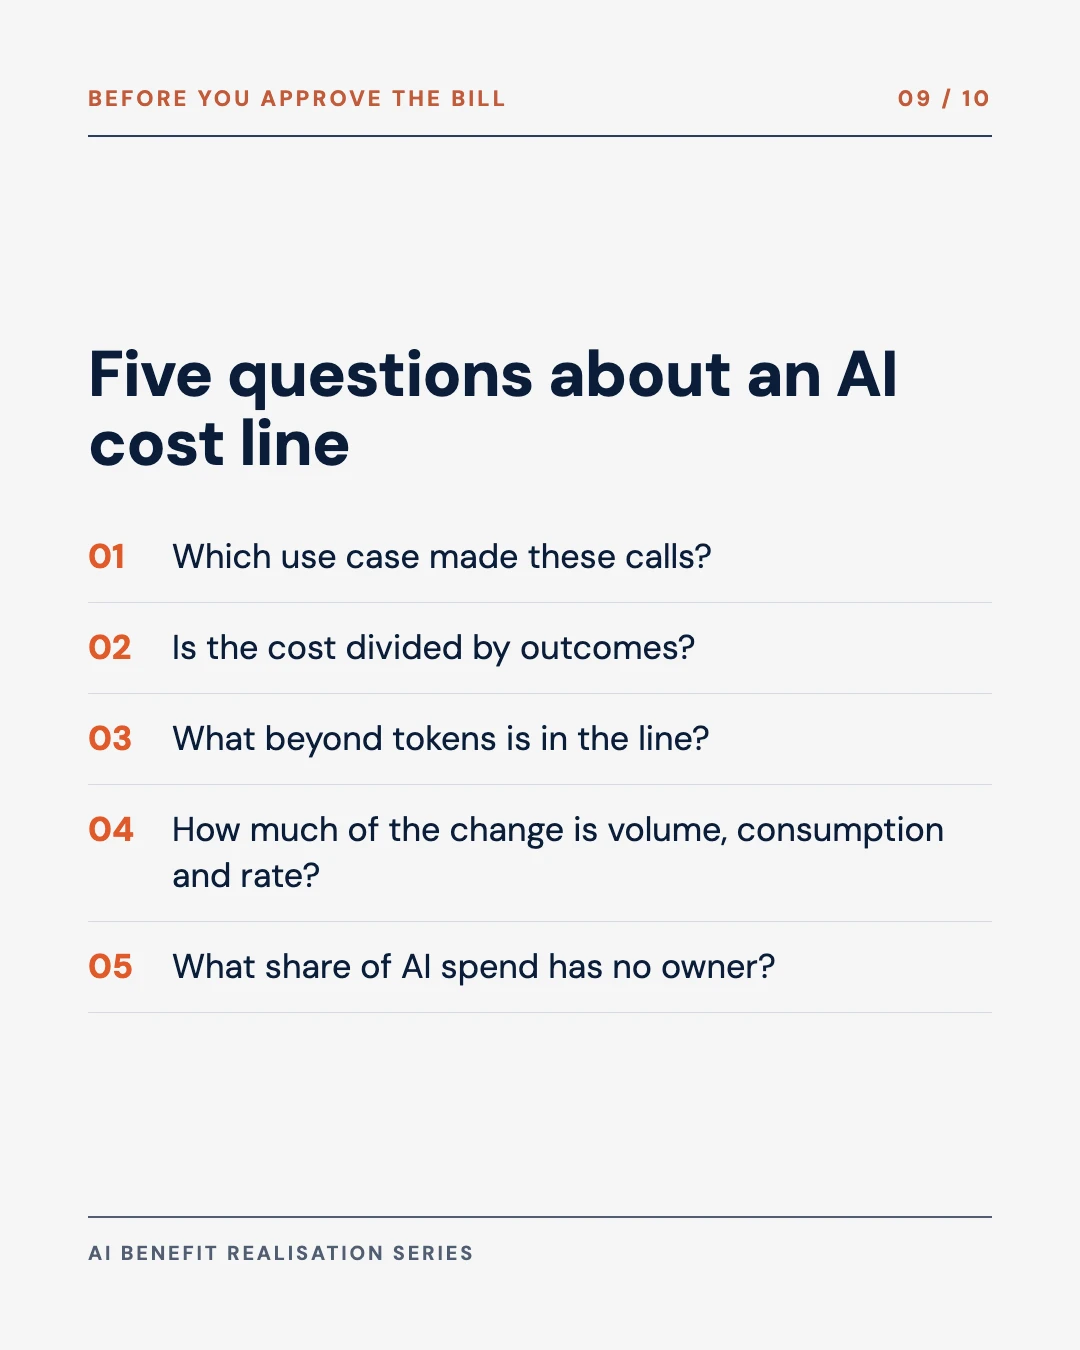
Questions to ask about an AI cost line
- Which use case made these calls, and is it the same ID as in the benefits register?
- Is the cost divided by outcomes, or by calls and tokens?
- Which costs beyond the model tokens are in the line, and which are left out?
- How much of this month’s change is volume, how much consumption per outcome and how much rate?
- What share of our AI spend has no owner?
Free tool
AI Value Ledger
Grade each AI use case by the method behind its benefit, and see the board figure built only from benefits that carry a comparison group.
Part 5 turns to funding: stage-gates for AI pilots, with kill criteria written in advance, so that a use case whose unit margin stays negative is stopped as a normal decision. The series page lists what is planned.
Evidence & Methodology
Prices, survey results and forecasts come from the publishers’ own pages, read in October 2026, except where noted. Gartner’s releases were read through syndicated copies of the release text. The worked example, its cost lines, the bridge and the review thresholds are our own proposal, and the figures in them are illustrative.
| Claim | Source | Grade |
|---|---|---|
| Price per token at a fixed performance level fell 9x to 900x a year depending on the task; about 40x for GPT-4-level PhD science questions | Epoch AI, LLM inference price trends, March 2025 | Measured, benchmark price analysis |
| Agentic models need 5 to 30 times more tokens per task than a standard chatbot | Gartner press release, March 2026 | Forecast, analyst estimate |
| Inference cost per agentic workflow to rise more than fivefold through 2028; “inference paradox”; tiering and routing recommended | Gartner press release, 2026 | Forecast, analyst estimate |
| 98% of practitioners manage AI spend, from 63% in 2025 and 31% in 2024; allocation to business units is a main difficulty | FinOps Foundation, State of FinOps 2026 | Measured, practitioner survey |
| FOCUS standard billing format; AI token workstream | FinOps Foundation, FOCUS 1.3, December 2025, and FOCUS technology categories page | Reported, standards body |
| Newer tokeniser produces about 30% more tokens for the same text; cache read 0.1x base input; Batch API 50% off; output five times input; 1.1x for US-only inference | Anthropic pricing documentation, October 2026 | Measured, published price list |
| S$19,000 monthly cost, 32% tokens, S$0.33 per draft and S$0.48 per reply, S$1.68 benefit, the S$14,000 to S$19,000 bridge | Illustrative example built for this post | Illustrative |
| Untagged share below a tenth within two quarters; 10% consumption-change threshold; accrue from gateway logs | Our practice and judgement | My call |
Sources
- Epoch AI. (2025). LLM inference prices have fallen rapidly but unequally across tasks. Data insight.
- Gartner. (2026). Gartner predicts that by 2030, performing inference on an LLM with 1 trillion parameters will cost GenAI providers over 90 percent less than in 2025. Press release.
- Gartner. (2026). Gartner predicts AI inference costs per agentic workflow will increase more than fivefold through 2028. Press release.
- FinOps Foundation. (2026). State of FinOps 2026.
- FinOps Foundation. (2025). FOCUS: the FinOps Open Cost and Usage Specification, version 1.3.
- Anthropic. (2026). Pricing. Claude Platform documentation.

Attribution Methods for AI Benefits
The benefit per outcome that this part sets the cost against.

A Joint CFO–CAIO Framework for AI Benefit Realisation
The benefits register whose IDs become the cost tags.

Setting the Baseline Before an AI Pilot Starts
Record the cost baseline in the same weeks as the benefit baseline.

Why Large Enterprises Are Deploying AI at Scale but Measuring It Incorrectly
The measurement mistakes that a cost line per use case also exposes.
My thanks to Dr. Christina Chua for co-writing this post and the series. Her view of how finance teams explain a cost shaped the sections on the monthly bridge, unused commitments and the review itself, including the month-end accrual from gateway logs. Christina is Director, Institutional Sales at Moomoo Financial Singapore. The post does not discuss Moomoo, and the views in it are not Moomoo’s.
If your organisation is paying a growing AI bill and cannot yet say which use case runs which part of it, setting up the cost line is a short piece of work I often start with. My consulting work covers AI governance and investment oversight for boards, finance leaders and public agencies.