
Executive Summary
Chief executives say only a quarter of their AI initiatives have delivered the return they expected, and Gartner expected at least 30 per cent of generative AI projects to be abandoned after proof of concept, citing escalating costs and unclear business value among the reasons. The failure is usually one of measurement and funding discipline, and it sits between two executives. The Chief AI Officer runs the work and the CFO owns the numbers, yet neither owns the full chain from starting point to realised benefit. We propose four controls the two sign together. A baseline recorded and signed before the pilot starts. An attribution method agreed in advance, from a randomised holdout down to a trend-adjusted before-and-after, with the confidence of each stated. A cost-per-outcome line for every AI use case, built from tagged inference spend and the human review that goes with it. And stage-gates with kill criteria written before the pilot begins, so that stopping funding becomes a routine decision with a record.
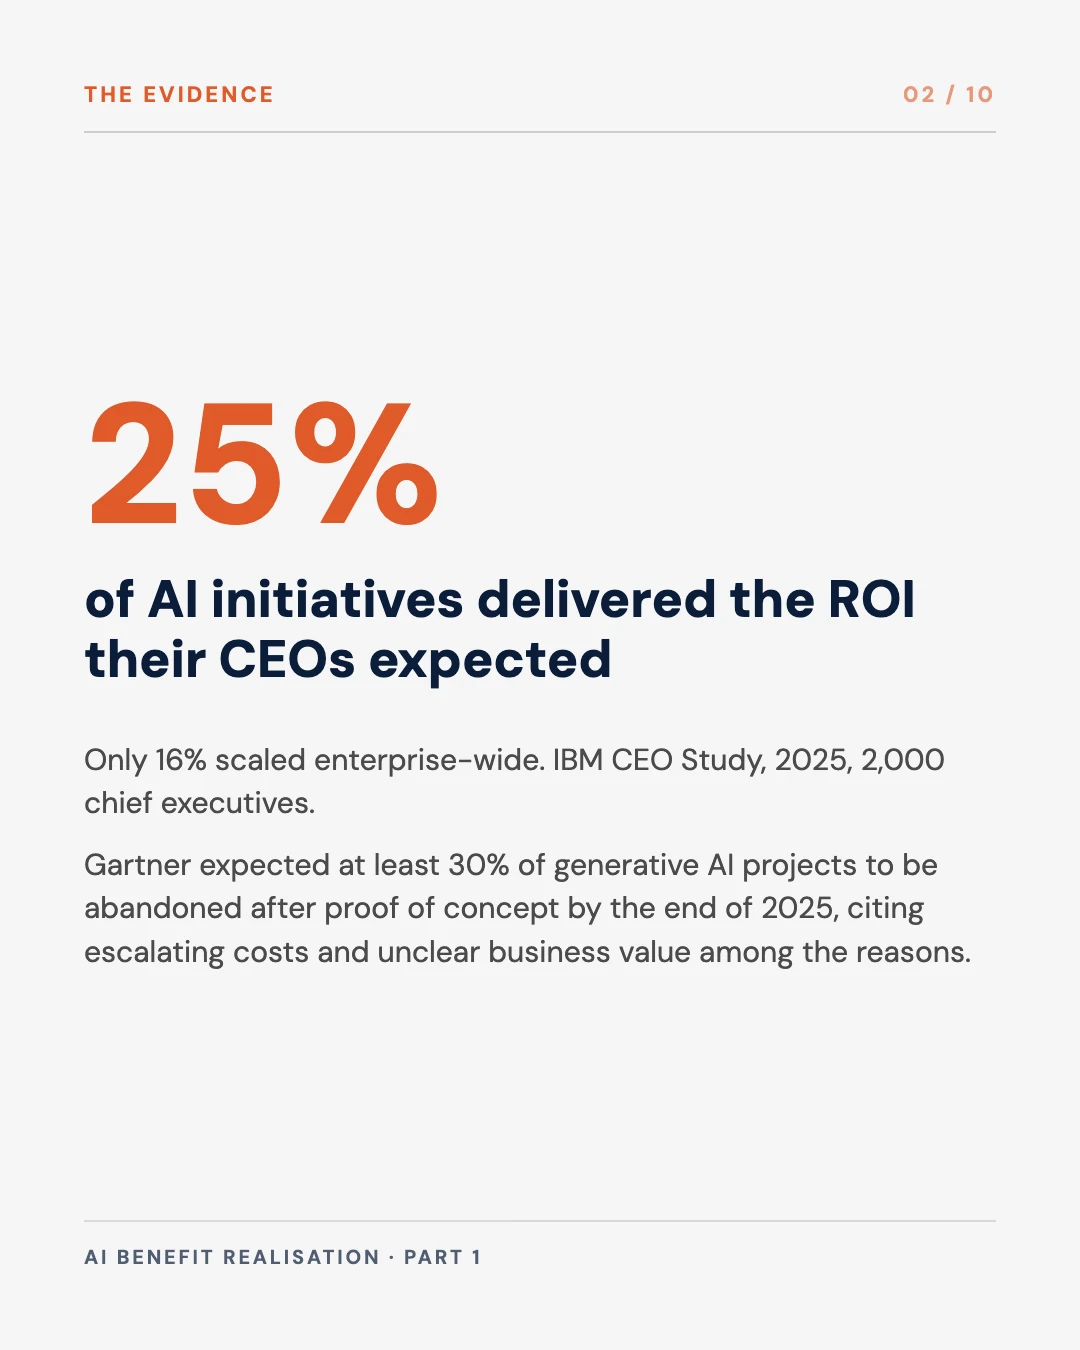
25%
of AI initiatives delivered expected ROI over the last few years, and 16% scaled enterprise-wide, IBM CEO Study, 2025
30%
of generative AI projects Gartner predicted would be abandoned after proof of concept by the end of 2025
98%
of FinOps practitioners now manage AI spend, up from 31% in 2024, State of FinOps 2026
5 to 30x
more tokens per task for agentic models than a standard chatbot, Gartner, March 2026
Core conclusions
- A benefit that was not baselined before the pilot started cannot be proven afterwards. The baseline record, its natural variance and the target should be signed by finance before the first production model call.
- Every claimed benefit should carry the attribution method behind it and a grade. A randomised holdout and a manager’s estimate are both evidence, but they should never be added together in one total.
- Falling prices per token do not mean a falling AI bill. Each use case needs a cost-per-outcome line that includes inference, retrieval, evaluation and human review, and gates that stop funding when the line does not close.
The argument, in ten slides
Save it, or send it to whoever chairs your AI investment committee.
This is the first part of a series Christina and I are writing on AI benefit realisation: how an organisation decides what an AI investment should return, proves whether it did, and stops paying for the ones that do not. Christina brings the finance view, from years of taking new products to clients through product, compliance, risk and technology teams that each measure success differently. I bring programme governance from infrastructure, where funding is released in stages against evidence. This part sets out the whole framework. Later parts take each control in turn.
Why AI benefits go unproven
The evidence that AI spending is underperforming is consistent, even where individual studies are weak. In IBM’s 2025 survey of 2,000 chief executives, respondents said “only 25% of AI initiatives have delivered expected ROI over the last few years, and only 16% have scaled enterprise wide.” In July 2024 Gartner predicted that at least 30 per cent of generative AI projects would be abandoned after proof of concept by the end of 2025, “due to poor data quality, inadequate risk controls, escalating costs or unclear business value.” A year later it predicted that over 40 per cent of agentic AI projects will be cancelled by the end of 2027, for almost the same reasons.
The most quoted figure of all, MIT NANDA’s finding that “95% of organizations are getting zero return”, deserves less weight than it gets. The report rests on interviews with 52 organisations, a survey of 153 leaders and a review of public announcements, and its authors describe the results as “directionally accurate based on individual interviews rather than official company reporting.” A Wharton survey later the same year found three in four leaders reporting positive returns. Neither is a measurement. Both record what executives believe, and that gap between belief and measurement is the problem this framework addresses.
Gartner’s finance research puts it most plainly. In May 2026 it reported that 63 per cent of finance organisations found AI implementation slower than expected in 2025, and one of its analysts said: “Counts of pilots, tools rolled out or use cases in production show that finance is moving, but they do not prove that AI is delivering the value.”
The ownership gap
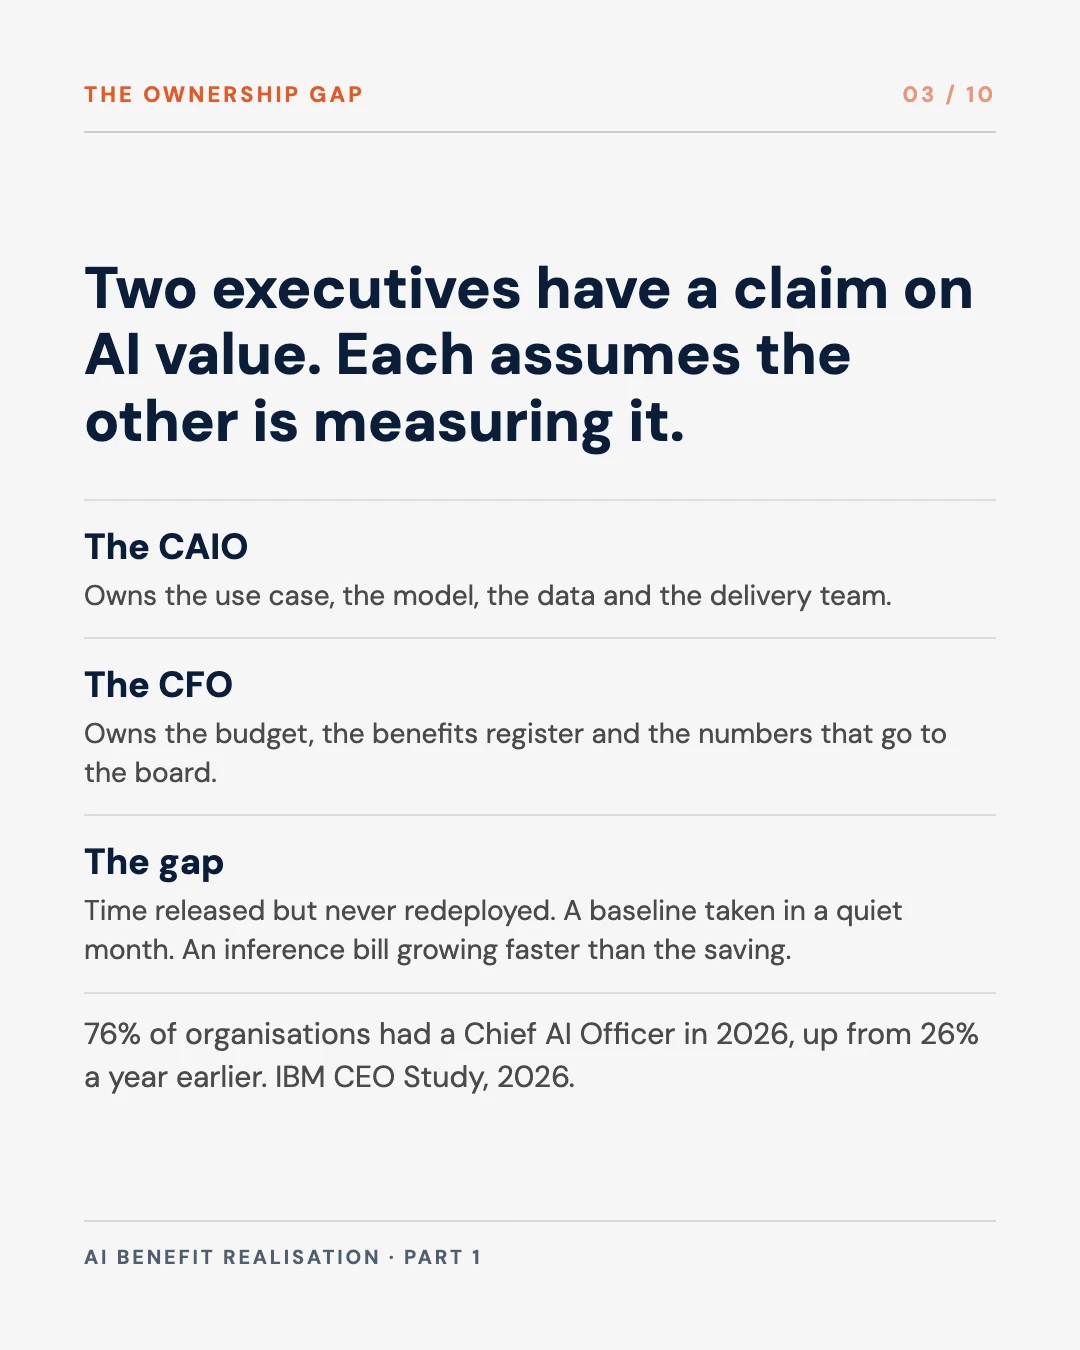
The reason the value goes unproven is structural. Most large organisations now have someone accountable for AI: IBM’s 2026 CEO study found 76 per cent had a Chief AI Officer, up from 26 per cent a year earlier. The same firm’s 2026 CFO study found 62 per cent of CFOs saying their role had expanded into technology or AI strategy. Two executives now have a claim on AI value, and in our experience each assumes the other is measuring it.
The CAIO owns the use case, the model, the data and the delivery team. The CFO owns the budget, the benefits register if there is one, and the numbers that go to the board. A benefit claim travels between them. The CAIO reports that a model cut handling time by a fifth, and the CFO cannot find the saving in the cost base. Neither is wrong. The time was released and nobody decided what to do with it, or the baseline was taken in a quiet month, or the inference bill grew faster than the saving. Each of those is a gap between the two offices.
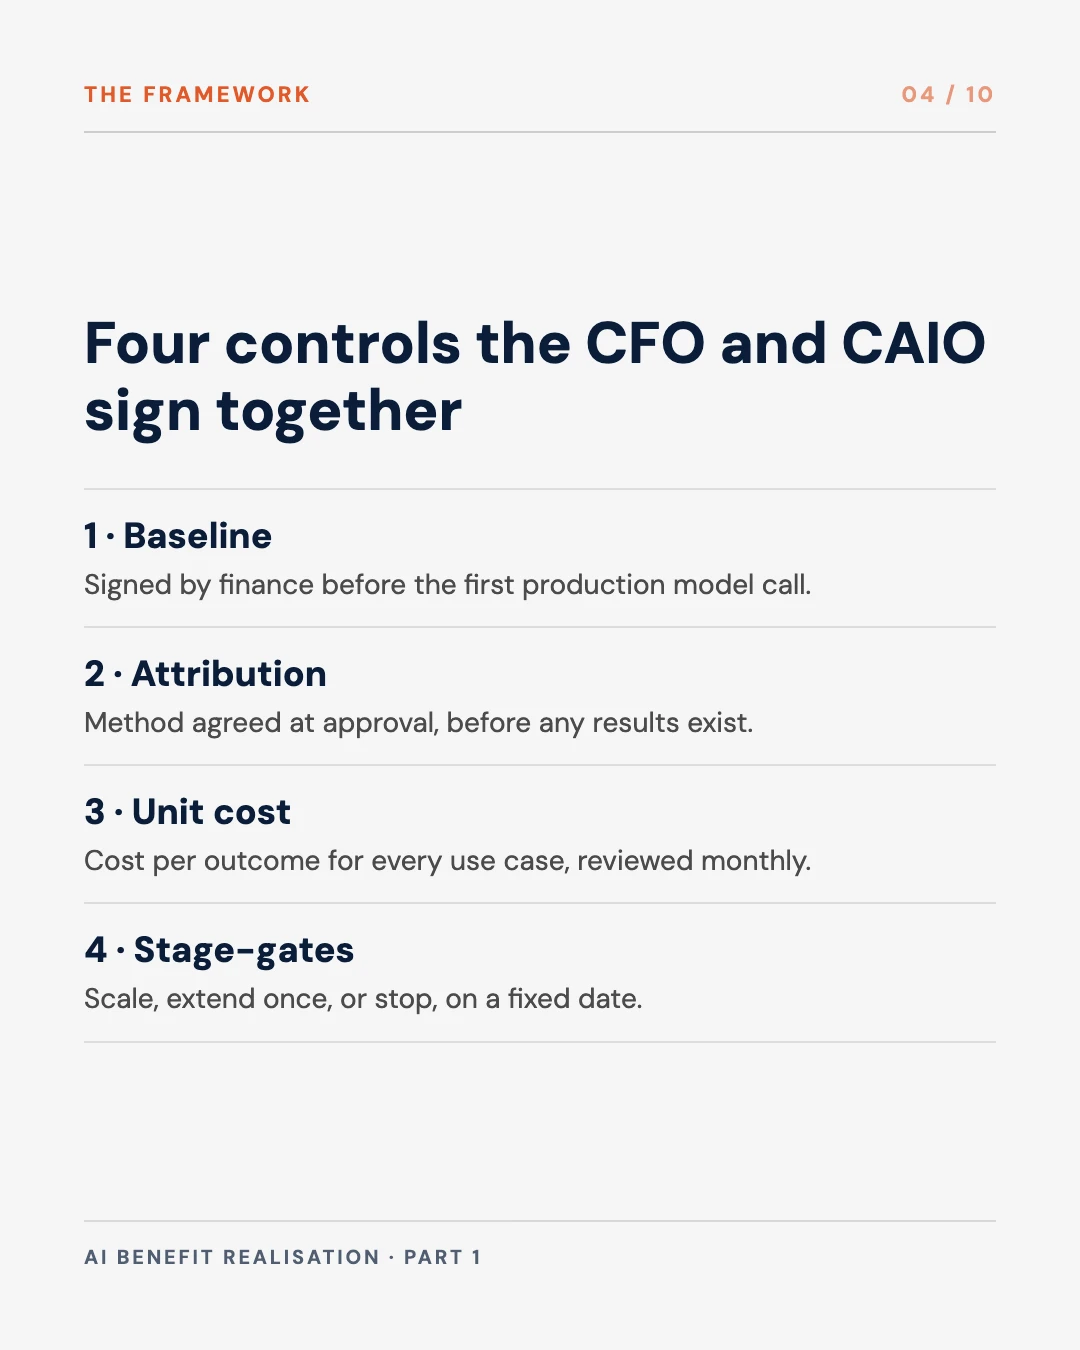
The fix is to make the chain a joint product. Four controls, each prepared by one office and signed by the other.
| Control | CAIO prepares | CFO signs | When |
|---|---|---|---|
| Baseline | Metric definitions, data source, measurement period, natural variance | The baseline record and the target, as a finance figure | Before the first production model call |
| Attribution | The method, the control group or comparison, the sample size | The grade of evidence each claimed benefit may carry | At pilot approval, before results exist |
| Unit cost | Tagged inference, retrieval and evaluation spend per use case | The fully loaded cost per outcome, including human review | Monthly, from the first day of the pilot |
| Stage-gates | The results against target, with method and confidence | The decision to scale, extend once, or stop | At each gate, on a fixed date |
Our proposed split of responsibilities. The point is that neither office can pass a gate alone.
Baseline definition
A baseline taken after the pilot starts is a reconstruction, and reconstructions flatter the pilot. The UK Infrastructure and Projects Authority’s guide to benefits management, written for major public projects, is direct about this: the baseline “should be taken during project initiation so that performance is not impacted by any element of project implementation”, and “it is essential to baseline each benefit measure.” It adds that “without a target benefits realisation success is difficult to determine.” None of this is new. It is rarely applied to AI, because AI pilots are cheap enough to start before anyone has thought about them as investments.
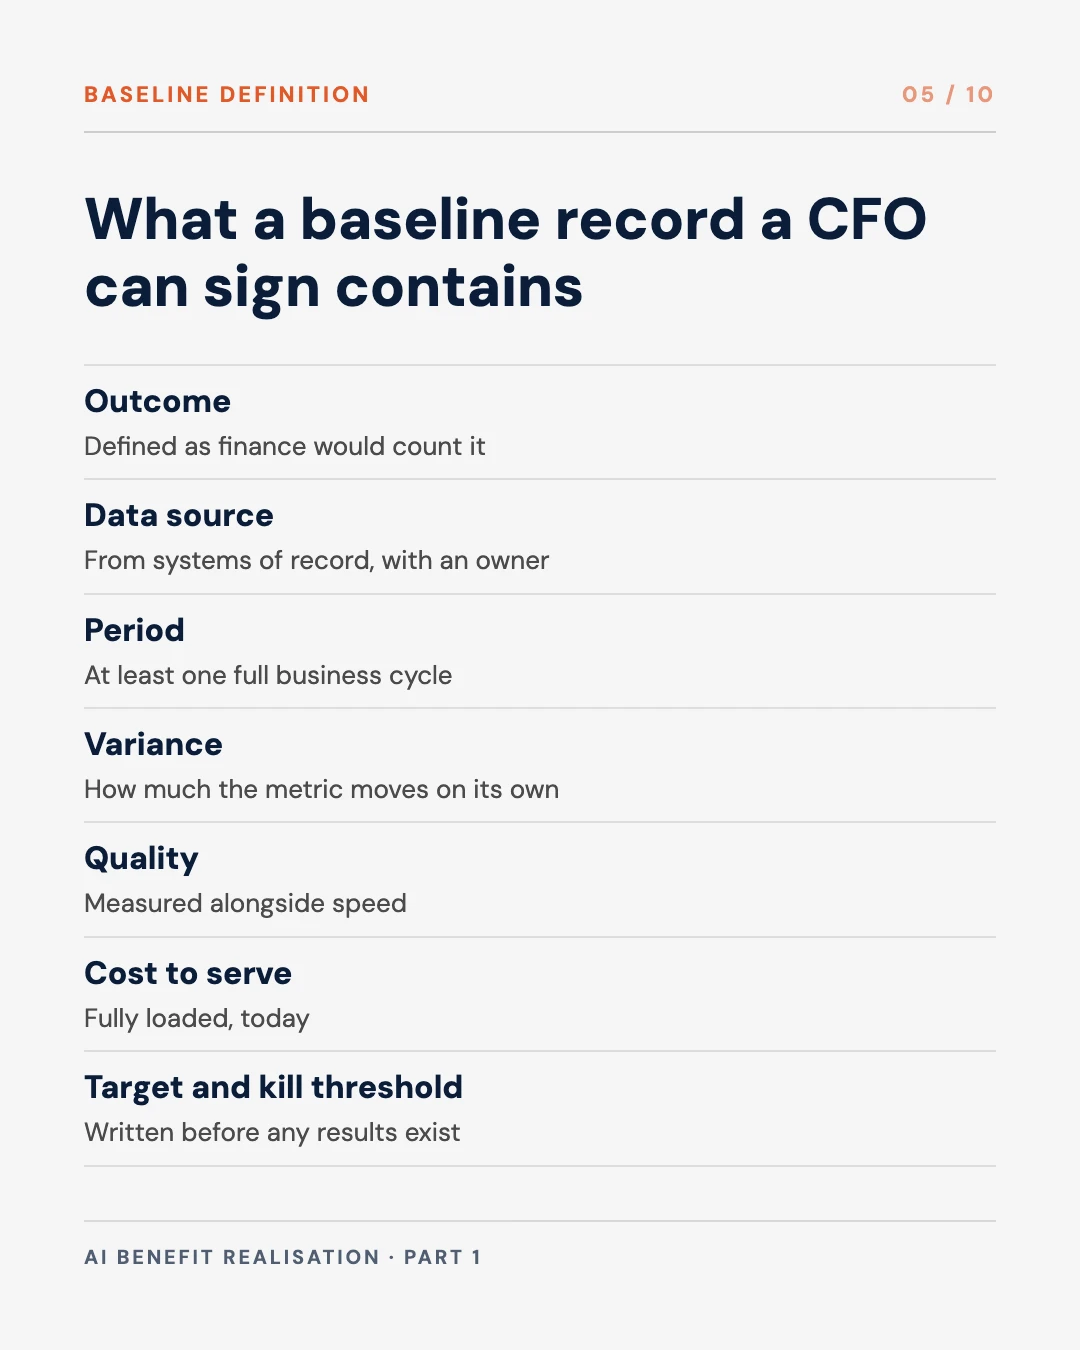
A baseline record a CFO can sign has seven parts:
- The outcome, defined as finance would count it. Cost per invoice processed, days to close, claims handled per adjuster per week. A model metric such as accuracy belongs in the quality guardrail.
- The data source and who owns it. Case-system timestamps, ledger entries or production counts, taken from systems of record. Estimates from the team that will run the pilot do not qualify.
- The measurement period. At least one full business cycle. A month that includes quarter-end, a seasonal peak or a system migration will distort everything that follows.
- The natural variance. How much the metric moves on its own from week to week. An improvement smaller than that spread is noise until proven otherwise, and the size of the spread decides how long the pilot must run.
- A quality measure alongside the speed measure. In the largest field study of generative AI at work, the most experienced customer-support agents saw “small gains in speed and small declines in quality.” A baseline that records only speed will report that loss as a gain.
- The current cost to serve. The fully loaded cost of producing the outcome today, so the benefit and the AI’s own running cost can be compared in the same unit.
- The target and the kill threshold. The improvement that justifies scaling, and the result below which funding stops. Both written down before any results exist.
The last item is the one that changes behaviour. A target agreed after results arrive tends to sit just below them.
Attribution methods
Most organisations change several things at once. A bank deploys an AI assistant to its contact centre in the same quarter that it redesigns its call routing, runs a campaign and hires a new team lead. If handling time falls, how much belongs to the AI?
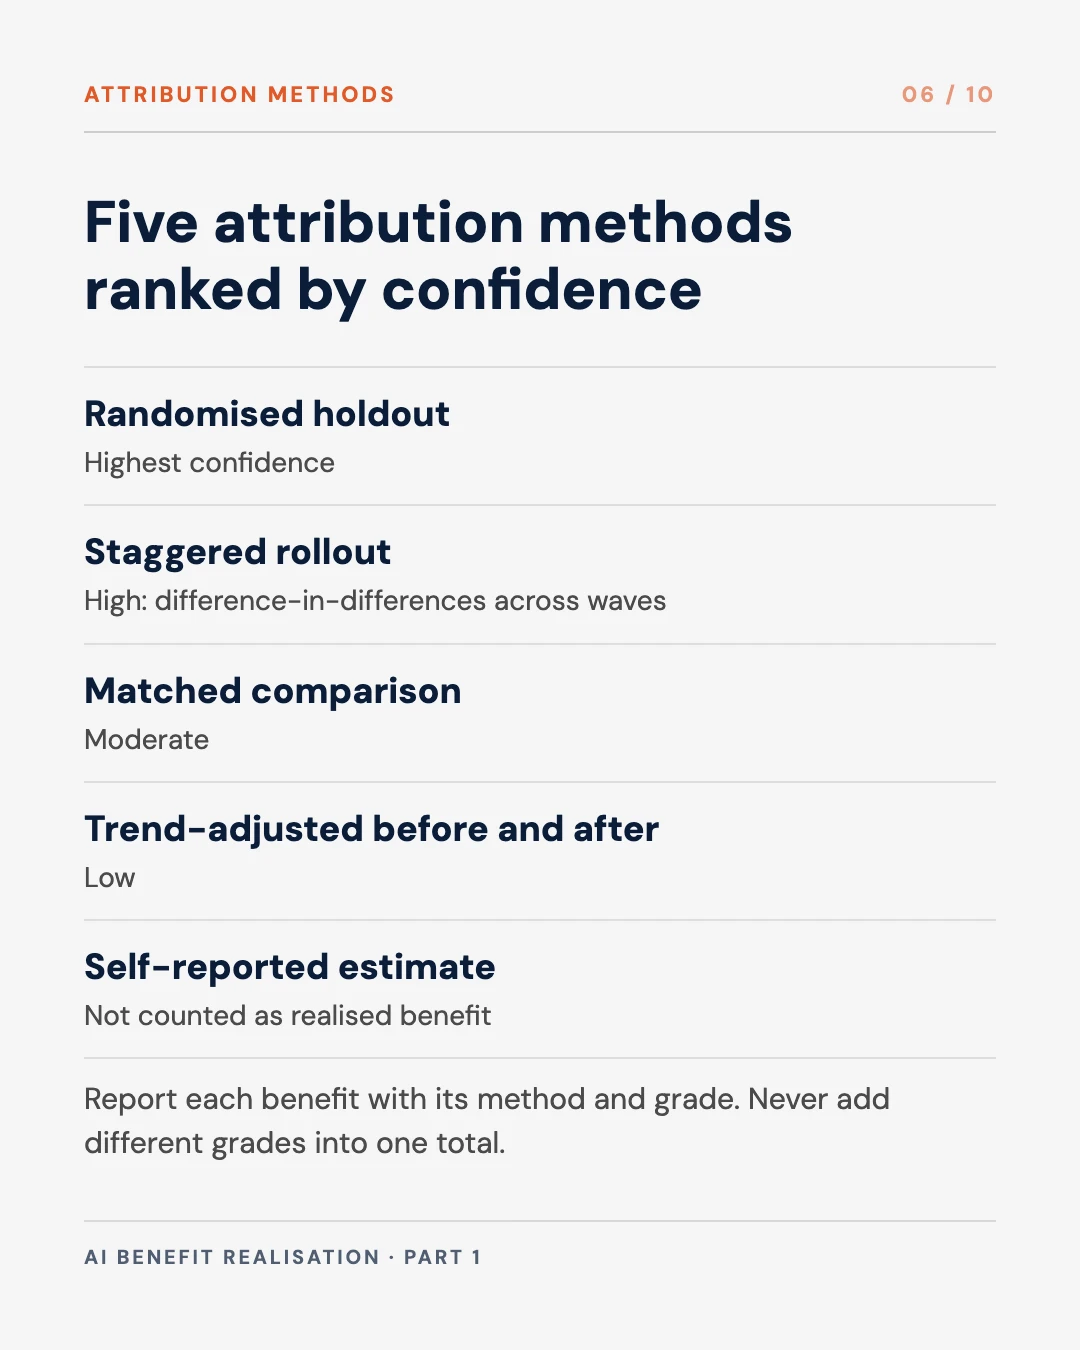
There are five ways to answer, and they give very different confidence.
Five attribution methods ranked by confidence
Schematic ranking, our judgement. Report each claimed benefit with its method and grade, and never add results from different rungs into one total.
A randomised holdout gives the strongest answer. Some teams, customers or cases are randomly assigned to work without the AI, and the difference is the effect. The clearest public example is the experiment Dell’Acqua and colleagues ran with 758 consultants at Boston Consulting Group, published this year. On tasks inside what the authors call the AI frontier, consultants with AI completed 12.2 per cent more tasks, 25.1 per cent faster, with significantly better quality. On a task outside it, they were 19 per cent less likely to reach a correct answer. Without the random assignment, that second finding would have been invisible.
A staggered rollout is the practical alternative when withholding the tool feels unacceptable. The AI reaches teams in waves, and each wave is compared with those still waiting, using a method economists call difference-in-differences. Brynjolfsson, Li and Raymond used a staggered rollout to study 5,172 customer-support agents and found productivity rose by 15 per cent on average, with large differences between novices and experienced staff. Most enterprise rollouts happen in waves anyway. Recording the order and the dates costs almost nothing.
A matched comparison pairs the pilot group with similar teams, branches or regions that did not get the AI, chosen before the pilot starts. It is weaker because the groups may differ in ways nobody measured.
A before-and-after with trend adjustment compares the pilot period with the baseline, corrected for the trend and seasonality the baseline revealed. It is often the only option for a single, organisation-wide system.
A self-reported estimate, from managers or users, is useful for deciding what to measure next. It should never be counted as a realised benefit.
The finance discipline here is simple. Every claimed benefit carries its method and a grade, and benefits of different grades are reported separately. A board pack that adds a holdout result to a manager’s estimate and presents one total has turned strong evidence into weak evidence. DBS, which reports AI economic value of about S$1 billion from more than 430 use cases, is the most visible example in Singapore of a bank publishing a single figure. We looked at what that figure measures and how a board should read it in an earlier post.
Two more rules prevent double counting. A saving claimed by one use case cannot also be claimed by another, so finance holds a single benefits register for every use case. And time released is not cash released. If a model frees a fifth of a team’s hours and nobody redeploys or reduces anything, the organisation has gained capacity and should report it as capacity.
Free tool
AI Value Ledger
List each AI use case with its owner, value type and test-and-control results. The ledger grades each one and totals only the value a board can defend, gross and net.
Inference cost accounting
The cost of a given level of AI capability is falling fast. Stanford’s 2025 AI Index found that the inference cost of a system performing at the level of GPT-3.5 “dropped over 280-fold between November 2022 and October 2024.” Epoch AI estimates prices for a fixed level of performance have been falling by between 9 and 900 times a year, depending on the task.
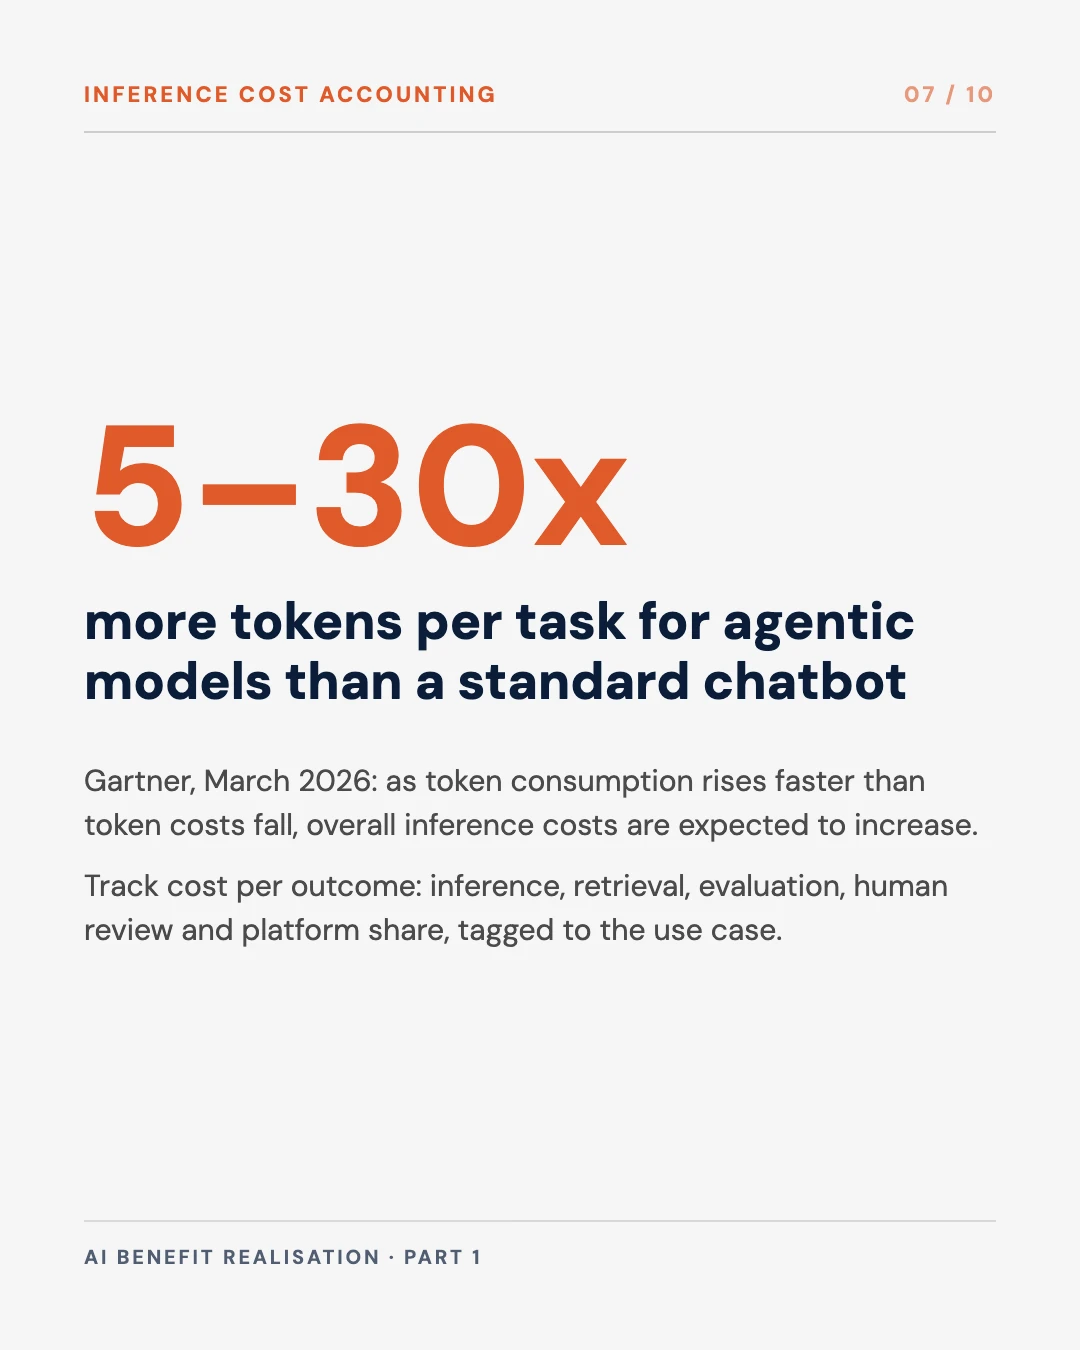
The bill is not falling with them. Gartner’s March 2026 forecast expects inference on a large model to cost providers over 90 per cent less by 2030, but warns that “falling GenAI provider token costs will not be fully passed on to enterprise customers.” Agentic models, it says, “require between 5-30 times more tokens per task than a standard GenAI chatbot”, and “as token consumption rises faster than token costs fall, overall inference costs are expected to increase.” A CFO who approved an AI budget on the strength of falling unit prices may find the total moving the other way.
The FinOps community, which built the discipline of cloud cost management, has moved quickly. In the State of FinOps 2026 survey of 1,192 practitioners, 98 per cent now manage AI spend, up from 63 per cent in 2025 and 31 per cent in 2024. Respondents also report being asked to “self-fund AI investments through optimization savings.” The FinOps Foundation defines cost per token and cost per inference as the basic units. Its co-founder J.R. Storment puts the purpose well: “The purpose of token economics is not to minimize token consumption. It is to connect token consumption to value.”
Cost per outcome
Cost per token is an engineering metric. Finance needs the cost per outcome: the full cost of one resolved query, one invoice processed or one claim assessed. That number has more lines than most AI cost reports include.
| Cost line | What it covers | Often missed because |
|---|---|---|
| Model inference | Input and output tokens, across every model call in the workflow | Agents make several calls per task, and retries count |
| Retrieval and data | Embedding, vector search, data platform queries | Billed to the data team’s budget |
| Evaluation and monitoring | Test runs, model-graded evaluations, drift checks | Treated as engineering overhead |
| Human review | Staff time checking, correcting or approving output | Sits in the operating budget of the business unit |
| Platform share | Gateway, logging, security tooling, allocated by volume | Shared across use cases and never allocated |
Our breakdown for a single AI use case. In the deployments we have reviewed, human review is the line most often left out and frequently the largest.
Three practices make the line possible. First, every model call is tagged with a use-case identifier at the point it is made, usually through a separate API key per use case or an AI gateway that adds the tag. Cost that is not tagged on the day it is incurred is very hard to allocate later. Second, the tagged spend is normalised into one format. The FinOps Foundation’s FOCUS specification already normalises billing data across cloud, SaaS and AI vendors, and the Linux Foundation has said version 1.5 will add native AI token tracking. Third, finance reviews cost per outcome monthly against the benefit per outcome from the baseline. A use case whose unit cost is rising faster than its unit benefit is a gate decision waiting to happen.
Accounting treatment
The accounting matters because it decides whose budget absorbs the spend. Under IAS 38, research costs are expensed and development costs that meet specific criteria may be capitalised. The IFRS Interpretations Committee’s 2021 agenda decision on cloud computing found that access to software under a SaaS arrangement is “a service”, and that configuration and customisation costs are generally expensed. Pay-per-use model APIs look much the same, and in our reading they are operating expenditure. That is our interpretation, since the standard setter has said nothing specific about AI, and each organisation should confirm it with its auditor. The practical point holds either way: most AI pilot spending lands in the profit and loss account in the year it is incurred, so it should be budgeted, gated and reviewed as operating spend.
Stage-gates that stop funding
Stage-gate funding is old. Robert Cooper described stage-gate systems for new product development in 1990, and the UK government’s Gateway reviews have long run from Gate 0 to Gate 5, with the last gate dedicated to operations and benefit realisation. What AI programmes usually lack is the willingness to use the gate to stop something.
Gartner’s 2026 finance research has started to say this directly. In March it advised CFOs to “stop looking for a single ROI formula and instead build a balanced portfolio”, scaling winners and “cutting weak ideas early.” In September it reported that the most mature uses in finance, such as data extraction and payables automation, generally return their investment within nine to ten months, and that finance leaders need to “know where to invest, when to cut underperforming initiatives.”
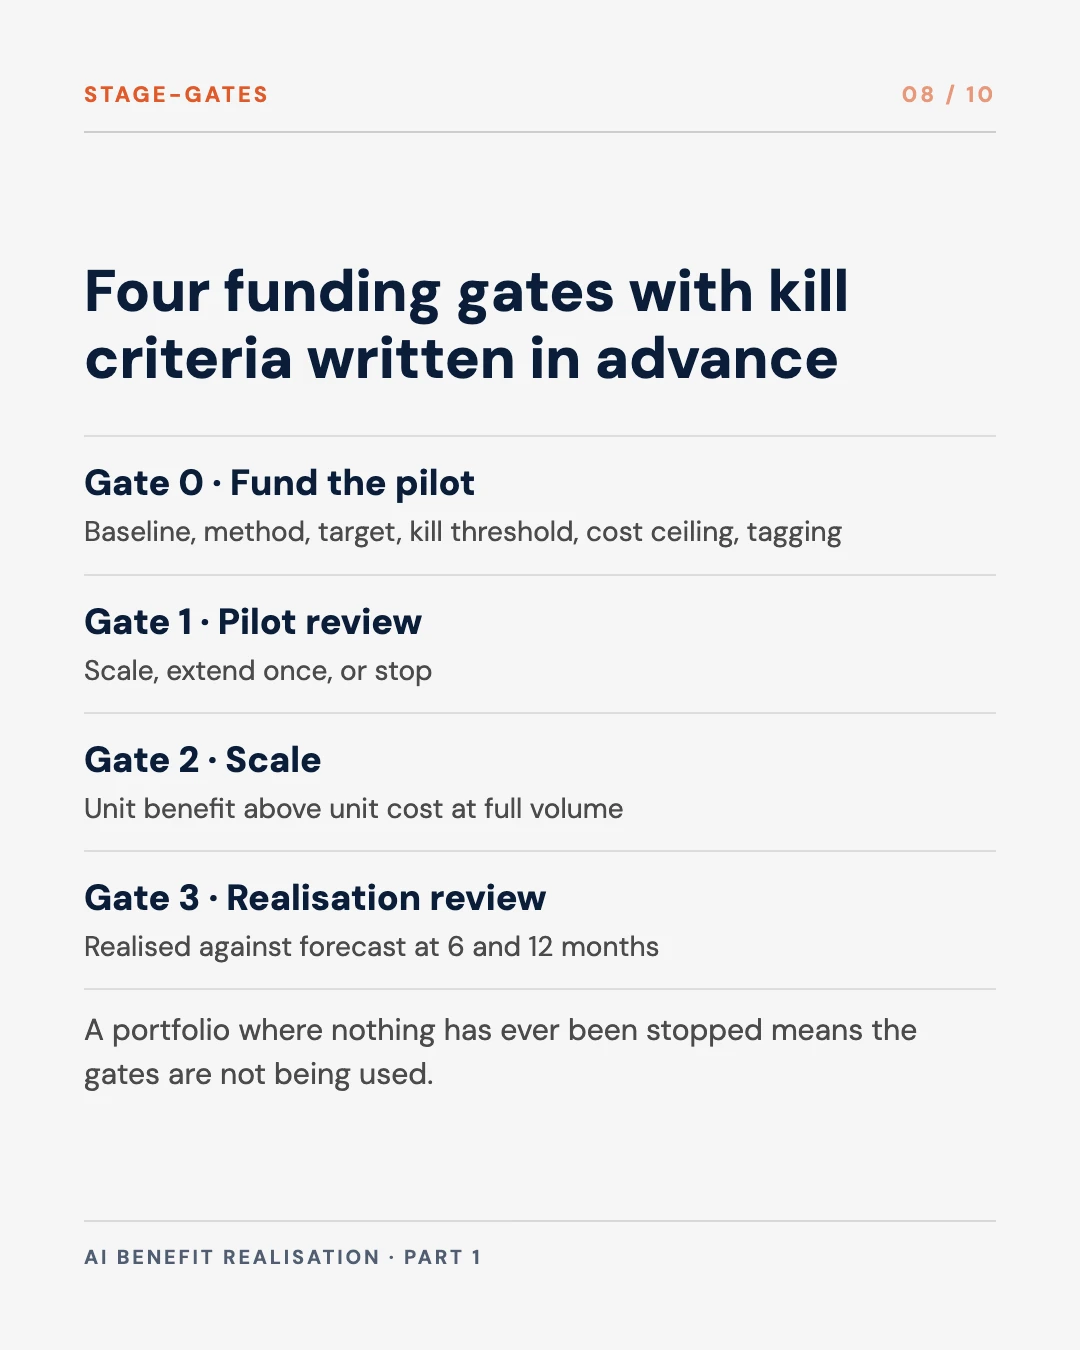
We propose four gates, each with criteria written before the work it governs.
Four funding gates for an AI use case
Our proposed gates, adapted from stage-gate practice and the UK Gateway review process. Kill criteria for every gate are written into the pilot charter before Gate 0.
Gate 0, fund the pilot. The baseline is signed, the attribution method is chosen, the target and kill threshold are written, a cost ceiling is set and tagging is in place. A pilot that cannot meet these conditions is not ready to start, however good the demonstration was.
Gate 1, pilot review. On a fixed date, usually eight to twelve weeks in, the CAIO presents the measured effect against target, with its method and confidence, the quality guardrail and the unit cost at pilot volume. There are three outcomes: scale, extend once with a named reason, or stop. A second extension should require the investment committee.
Gate 2, scale. The unit cost is projected at full volume, with token growth included, and the benefit per outcome must exceed it by a margin agreed in advance. The use case enters the AI inventory with its risk controls. For Singapore financial institutions, MAS’s final Guidelines on AI Risk Management, issued on 7 October 2026, expect firms to “maintain inventories at an appropriate level of granularity” and to assess the risk materiality of each AI use. The same inventory is the natural home for the benefit record.
Gate 3, benefit realisation review. Six and twelve months after scaling, finance compares realised benefit with the forecast that justified the scale-up and checks that the baseline still describes the business. Use cases with negative net value are retired, and each retirement is recorded as a gate decision.
Kill criteria
Kill criteria are what make a gate work. We would write four into every pilot charter:
- The measured effect, at the agreed confidence, is below the kill threshold.
- The unit cost at projected volume exceeds the unit benefit.
- The quality guardrail is breached and cannot be fixed within the extension.
- The agreed attribution method could not be run, so the benefit cannot be measured.
The fourth is the one teams resist most, because the pilot may well be working. It belongs on the list anyway. A benefit that cannot be measured cannot be defended to a board, an auditor or a regulator, and it cannot be compared with the next use case competing for the same money.
Making stopping normal
The hardest part is cultural. A pilot stopped at Gate 1 with a clean measurement has done its job: it has bought information cheaply. We would report the stop rate to the investment committee as a measure of the gates’ health. A portfolio in which nothing has ever been stopped does not mean every pilot succeeded. It means the gates are not being used.
The Singapore context
Singapore is pushing AI adoption hard and asking for outcomes in return. Budget 2024 committed more than S$1 billion over five years to AI compute, talent and industry development. Budget 2026 announced national AI Missions in four sectors, including finance, each “anchored in clear objectives and tangible outcomes”, and expanded the Enterprise Innovation Scheme to include AI expenditure as a qualifying activity for the Years of Assessment 2027 and 2028, capped at S$50,000 a year. A firm that cannot identify its AI spending by use case will find that claim harder to support.
For financial institutions, the final MAS guidelines take effect on 7 October 2027, with some sections following a year later. They expect boards and senior management to provide “effective oversight of AI risks, including by setting clear roles and responsibilities” and a risk appetite. A joint CFO and CAIO gate, with written criteria and a record of every decision, is evidence of exactly that oversight. We found no published Singapore government guidance on benefits realisation for AI programmes. The UK’s Gate 5 review is the closest public-sector model, and it adapts well.
What to do this quarter
- Name the joint owners. For each AI use case, record the CAIO-side owner of delivery and the finance-side owner of the benefit.
- Baseline before the next pilot starts. Use the seven-part record and have finance sign it.
- Agree attribution at approval. Write the method into the pilot charter, and plan a staggered rollout wherever a holdout is impractical.
- Tag every model call. One identifier per use case, from day one, with spend normalised and reviewed monthly.
- Build the cost-per-outcome line. Include inference, retrieval, evaluation, human review and platform share.
- Write the gates and kill criteria. Fixed dates, three outcomes at Gate 1, one extension without committee approval.
- Report benefits by grade. Holdout and staggered-rollout results in one column, estimates in another, never summed.
Questions for the investment committee
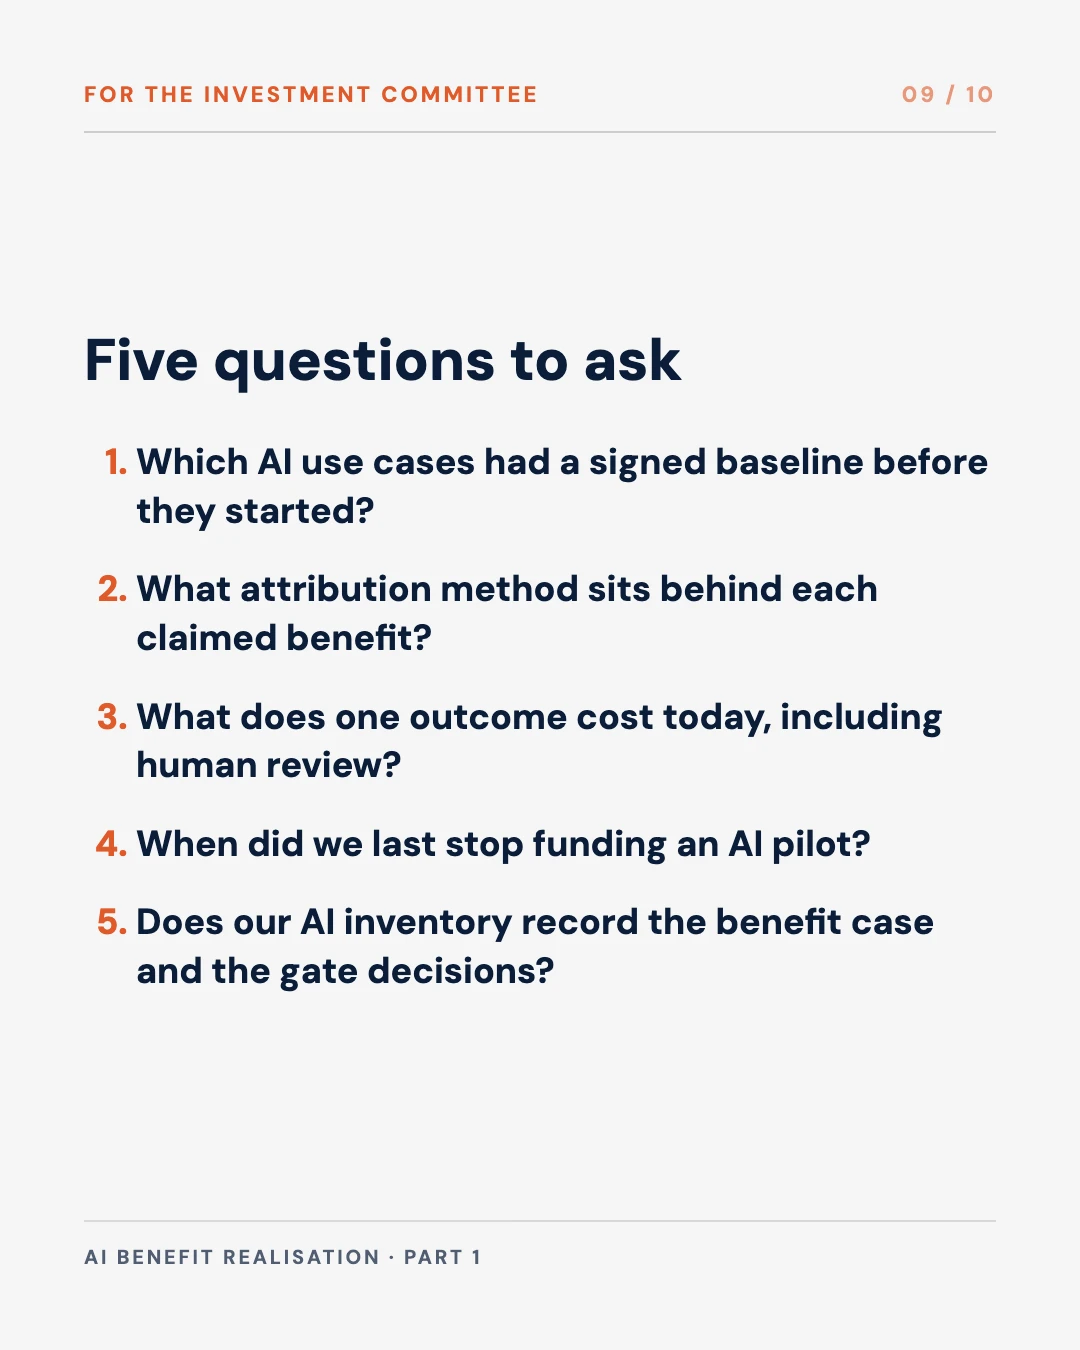
- Which of our AI use cases had a signed baseline before they started?
- For each claimed benefit, what attribution method sits behind it?
- What does one outcome cost us today for each use case, including human review, and is that cost rising or falling?
- When did we last stop funding an AI pilot, and what did we learn from it?
- Does our AI inventory record the benefit case and the gate decisions, as well as the risk assessment?
Free tool
Enterprise AI Value and Adoption Dashboard
Lay out total cost of ownership, AI-influenced revenue, cost savings and adoption by business unit, with notes on how to measure each.
The next parts of the series take each control in more depth, starting with the baseline record. The series page lists what is planned.
Evidence & Methodology
Survey figures, forecasts and regulatory text come from the publishers’ own releases and documents, read in early October 2026. Where a study has a published version and an earlier working paper with different numbers, we have used the published one. The decision-rights split, the seven-part baseline, the cost-per-outcome lines, the gates and the kill criteria are our own proposal, adapted from UK benefits management guidance and stage-gate practice, and we have marked them as such.
| Claim | Source | Grade |
|---|---|---|
| 25% of AI initiatives delivered expected ROI; 16% scaled | IBM CEO Study, May 2025, 2,000 CEOs | Reported, executive survey |
| At least 30% of GenAI projects abandoned after proof of concept by end-2025 | Gartner press release, July 2024 | Forecast |
| Over 40% of agentic AI projects cancelled by end-2027 | Gartner press release, June 2025 | Forecast |
| ”95% of organizations are getting zero return” | MIT NANDA, July 2025; 52 interviews, 153 survey responses, authors’ own caveats | Reported, contested |
| Three in four leaders see positive GenAI returns | Wharton and GBK Collective, October 2025 | Reported, executive survey |
| 63% of finance organisations found AI slower than expected | Gartner press release, May 2026 | Reported, survey |
| 76% of organisations have a CAIO, up from 26% | IBM CEO Study, May 2026 | Reported, executive survey |
| 62% of CFOs say their role expanded into technology or AI strategy | IBM CFO Study, September 2026, 1,500 CFOs | Reported, executive survey |
| Baseline at initiation; baseline each measure; target needed | UK IPA, Guide for Effective Benefits Management in Major Projects, 2017 | Measured, government guidance |
| 758 consultants; 12.2% more tasks, 25.1% faster; 19% less likely correct outside the frontier | Dell’Acqua et al., Organization Science, 2026 | Measured, randomised experiment |
| 5,172 agents; 15% average productivity gain; quality declines for most experienced | Brynjolfsson, Li and Raymond, Quarterly Journal of Economics, 2025 | Measured, staggered rollout |
| DBS economic value of about S$1 billion from 430+ use cases | DBS Annual Report 2025 | Reported by the company |
| GPT-3.5-level inference cost fell over 280-fold | Stanford AI Index 2025 | Measured |
| Prices for fixed performance falling 9x to 900x a year | Epoch AI, March 2025 | Measured, with the authors’ caveat on persistence |
| 5 to 30 times more tokens per task for agents; overall inference costs expected to rise | Gartner press release, March 2026 | Forecast |
| 98% manage AI spend, from 31% in 2024; asked to self-fund AI | State of FinOps 2026, 1,192 respondents | Reported, practitioner survey |
| Cost per token and cost per inference definitions; token economics quote | FinOps Foundation, 2026 | Measured, industry body |
| FOCUS covers AI billing; 1.5 to add native token tracking | FinOps Foundation; Linux Foundation, June 2026 | Reported, standards body |
| SaaS access is a service; configuration costs generally expensed | IFRIC agenda decision, March 2021; IAS 38 | Measured, standard setter |
| Pay-per-use model APIs are operating expenditure | Our reading of IAS 38 and the 2021 agenda decision | My call, confirm with auditor |
| Gartner advice to cut weak ideas early; nine-to-ten-month returns for mature finance uses | Gartner press releases, March and September 2026 | Reported, analyst survey |
| Stage-gate systems; UK Gateway 0 to 5 with benefit realisation at Gate 5 | Cooper, Business Horizons, 1990; UK government Gate 5 guidance | Measured, published record |
| MAS AI risk guidelines final 7 October 2026; inventories; board oversight | MAS media release, October 2026 | Measured, regulator record |
| Budget 2024 S$1bn+; Budget 2026 AI Missions and Enterprise Innovation Scheme | MDDI, February 2024; Budget 2026 statement | Measured, government record |
| Human review is the cost line most often left out | Deployments we have reviewed | My call |
| Decision-rights table, seven-part baseline, attribution ladder, cost lines, four gates, kill criteria | Our proposal, adapted from UK IPA benefits guidance and stage-gate practice | My call |
Sources
- IBM. (2025). IBM study: CEOs double down on AI while navigating enterprise hurdles.
- Gartner. (2024). Gartner predicts 30% of generative AI projects will be abandoned after proof of concept by end of 2025.
- Gartner. (2025). Gartner predicts over 40% of agentic AI projects will be canceled by end of 2027.
- Challapally, A., Pease, C., Raskar, R., and Chari, P. (2025). The GenAI divide: state of AI in business 2025. MIT NANDA.
- Wharton School and GBK Collective. (2025). Accountable acceleration: gen AI fast-tracks into the enterprise.
- Gartner. (2026). Finance AI press releases, 24 March, 28 May and 24 September 2026.
- IBM. (2026). IBM study: CEOs are reshaping C-suite roles for the AI era.
- IBM. (2026). IBM study: as AI scales enterprise-wide, CFOs play an expanded role in transformation.
- Infrastructure and Projects Authority. (2017). Guide for effective benefits management in major projects.
- Dell’Acqua, F., et al. (2026). Navigating the jagged technological frontier. Organization Science, 37(2), 403-423.
- Brynjolfsson, E., Li, D., and Raymond, L. (2025). Generative AI at work. Quarterly Journal of Economics, 140(2), 889-942.
- DBS Group. (2026). Annual report 2025: letter from the chairman and CEO.
- Stanford HAI. (2025). AI Index report 2025.
- Epoch AI. (2025). LLM inference prices have fallen rapidly but unequally across tasks.
- Gartner. (2026). Gartner predicts that by 2030 performing inference on an LLM with 1 trillion parameters will cost GenAI providers over 90% less than in 2025.
- FinOps Foundation. (2026). State of FinOps 2026.
- FinOps Foundation. (2026). FinOps for AI overview.
- Storment, J.R. (2026). Token economics: the atomic unit of AI value. FinOps Foundation.
- FinOps Foundation. FOCUS: the FinOps open cost and usage specification.
- Linux Foundation. (2026). Linux Foundation announces Tokenomicon, a new conference for the economics of AI.
- IFRS Foundation. IAS 38 Intangible assets.
- IFRS Interpretations Committee. (2021). Configuration or customisation costs in a cloud computing arrangement.
- Cooper, R.G. (1990). Stage-gate systems: a new tool for managing new products. Business Horizons, 33(3), 44-54.
- UK Government. (2026). Gate review 5: operations review and benefit realisation.
- Monetary Authority of Singapore. (2026). MAS sets out supervisory expectations on responsible AI adoption by financial institutions.
- Ministry of Digital Development and Information. (2024). AI initiatives launched to uplift Singapore’s economic potential.
- Ministry of Finance, Singapore. (2026). Budget 2026 statement: harness AI as a strategic advantage.

What DBS's S$1 Billion in AI Value Measures, and How a Board Should Read It
The control-group method behind the best-known AI value number in Singapore, and its limits.

Why Large Enterprises Are Deploying AI at Scale but Measuring It Incorrectly
The measurement mistakes that make a baseline and an attribution method necessary.

Token Optimisation Is an Engineering Discipline
How engineering teams bring the inference line down once finance can see it.

The Lean Way to Build AI: Small Bets, Real Evidence, Fewer Failed Pilots
The delivery habits that make stage-gates cheap to run.
My thanks to Dr. Christina Chua for co-writing this post and the series it opens. Her experience of how financial firms approve, fund and review new products shaped the baseline, decision-rights and stage-gate sections. Christina is Director, Institutional Sales at Moomoo Financial Singapore. The post does not discuss Moomoo, and the views in it are not Moomoo’s.
If your organisation is deciding which AI pilots to scale and which to stop, the joint baseline and the Gate 1 review are where I usually start. My consulting work covers AI governance and investment oversight for boards, finance leaders and public agencies.