
Executive Summary
An AI pilot almost never runs alone. In the same quarter the business changes its call routing, runs a campaign and hires a new team lead, and a before-and-after comparison credits all of it to the model. Attribution is the work of finding out what would have happened without the AI, and the only reliable way to do that is a comparison group measured over the same weeks. A randomised holdout gives the strongest answer, and the largest published trials show how noisy even that can be: three randomised experiments with 4,867 developers produced a 26 per cent gain with a standard error of 10 points. Where a holdout is impractical, a staggered rollout with randomised wave order comes close. A switchback test fits systems that cannot be split by user. Synthetic controls and trend-adjusted comparisons are for single, organisation-wide changes and carry lower confidence. Whatever the method, it is chosen and written into the pilot charter before results exist, and the benefit is booked per licence paid for, including the people who never use the tool.
26%
more completed tasks across three randomised trials with 4,867 developers, standard error 10.3 points, Cui et al., Management Science
7,137
knowledge workers in 66 firms randomly given an AI assistant or not, Dillon et al., 2025
19%
less likely to be correct on a task outside the AI frontier, found only because consultants were randomly assigned, Dell’Acqua et al.
80%
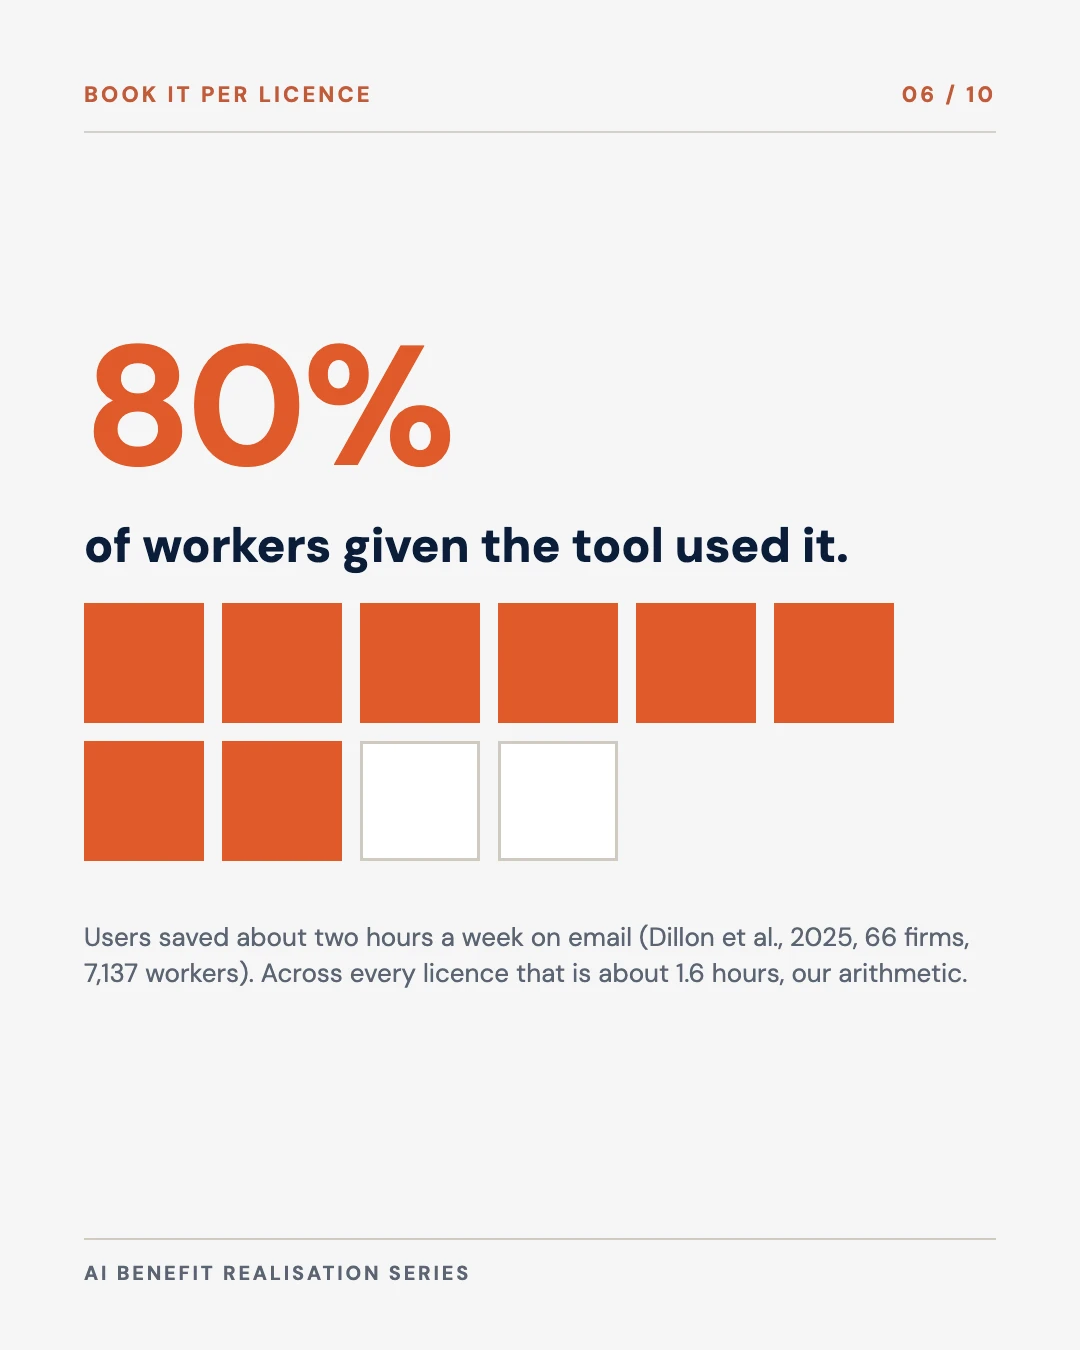
of workers given the tool used it, so the measured saving applies to them and not to every licence, Dillon et al., 2025
Core conclusions
- A benefit is the difference between the pilot group and a comparison group measured over the same weeks. A comparison with last year’s numbers measures the AI plus everything else that changed.
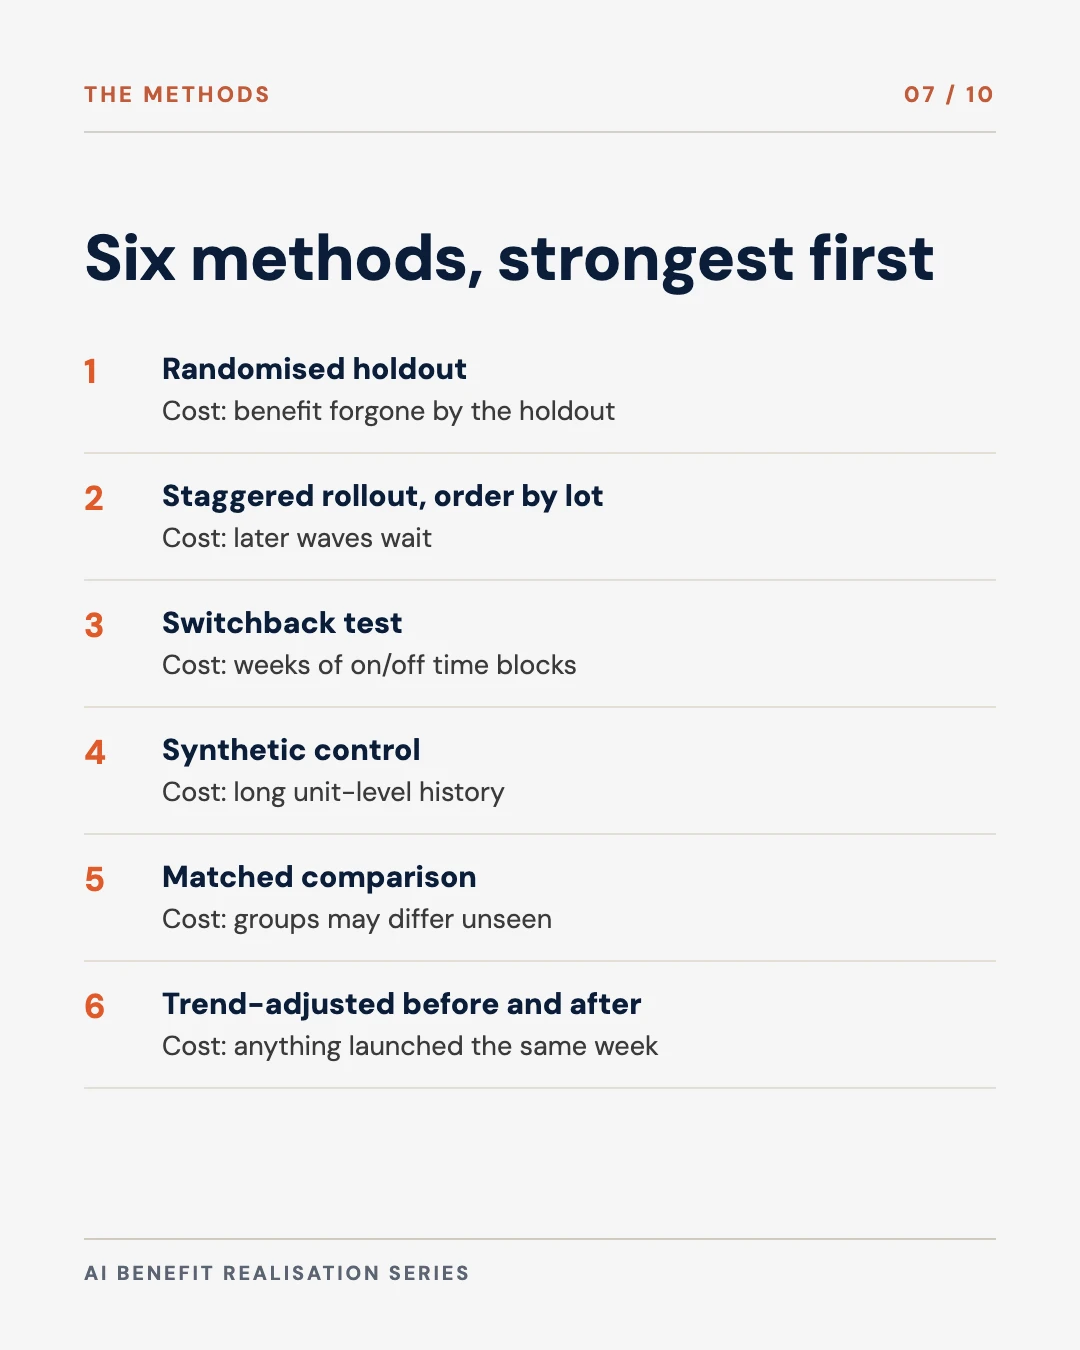
- Choose the method at approval, from the strongest the use case allows: randomised holdout, staggered rollout with randomised wave order, switchback, synthetic control, then trend-adjusted before-and-after. Record the choice in the pilot charter.
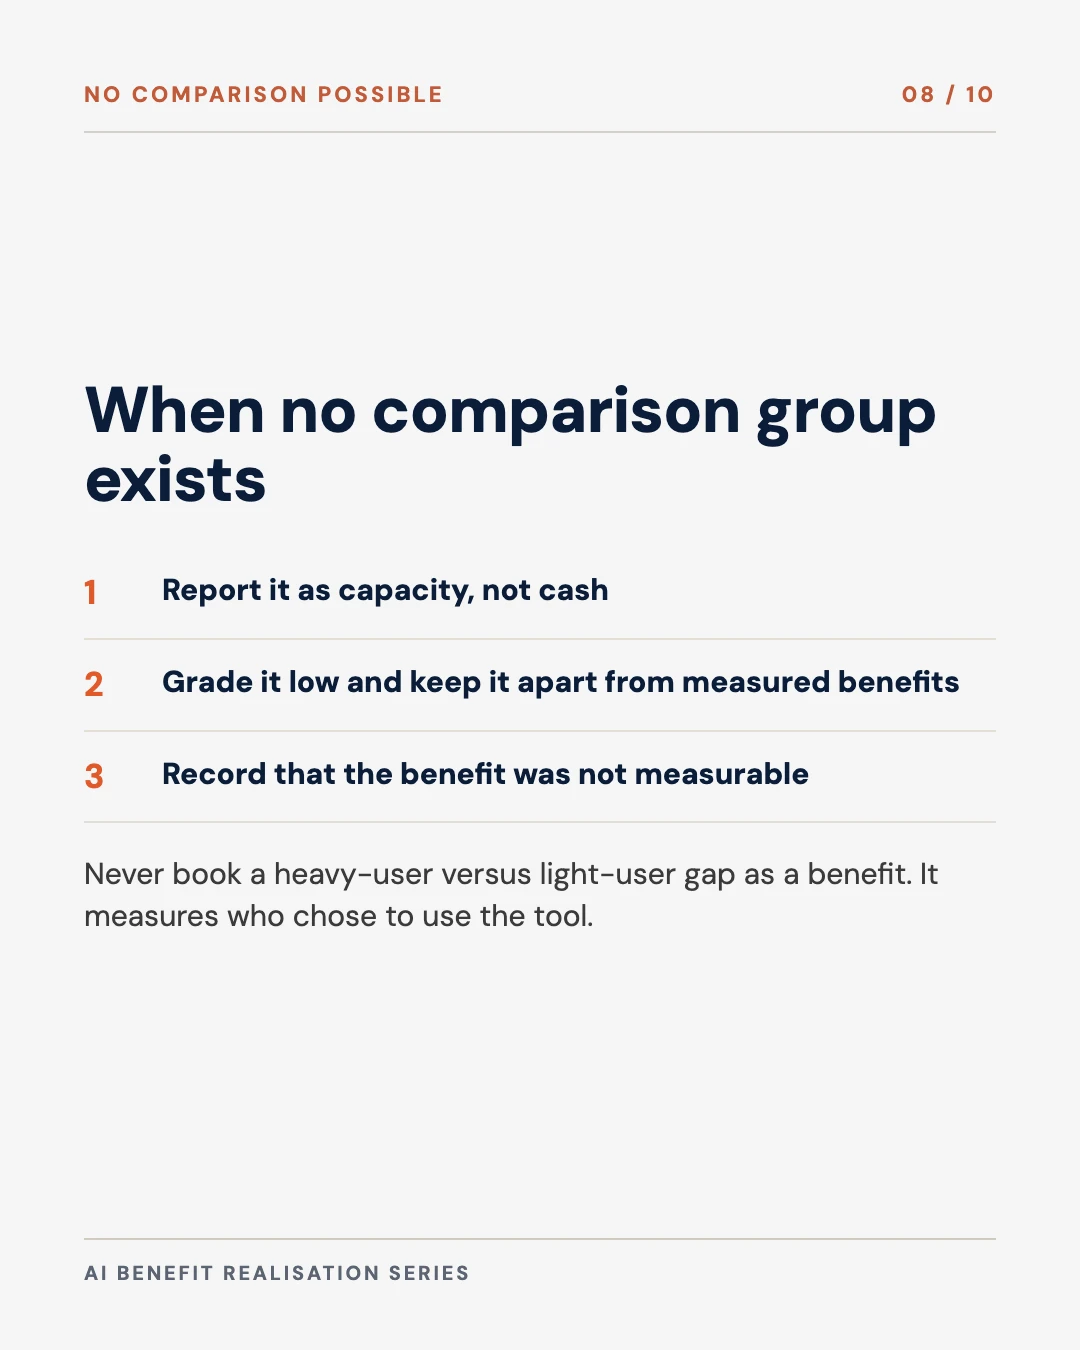
- Book the effect per licence paid for, which includes the people who never used the tool. Comparing heavy users with light users measures who chose to use it, and should not be reported as a benefit.
The argument, in ten slides
Save it, or send it to whoever signs off your AI benefits register.
This is the third part of the series Christina and I are writing on AI benefit realisation. Part 1 set out four controls the CFO and the Chief AI Officer sign together, and ranked five attribution methods by the confidence they give. Part 2 covered the baseline. This part covers the methods themselves: how to run each one, what it costs, which use cases it suits, and what to do when no comparison group is possible. Christina brings the finance view to this part: what a CFO can book against a method, what each method should cost at approval, and how to report a benefit that no method can attribute.
The question attribution answers
Every claimed AI benefit is a comparison with something that did not happen: the same team, over the same weeks, without the AI. Nobody can observe that directly, so every method is a way of estimating it. HM Treasury’s evaluation guidance, the Magenta Book, lists the main options in its annex on analytical methods: randomised controlled trials, difference-in-differences, synthetic control, interrupted time series and several others. They differ in how much they assume, and so in how far finance can rely on them.
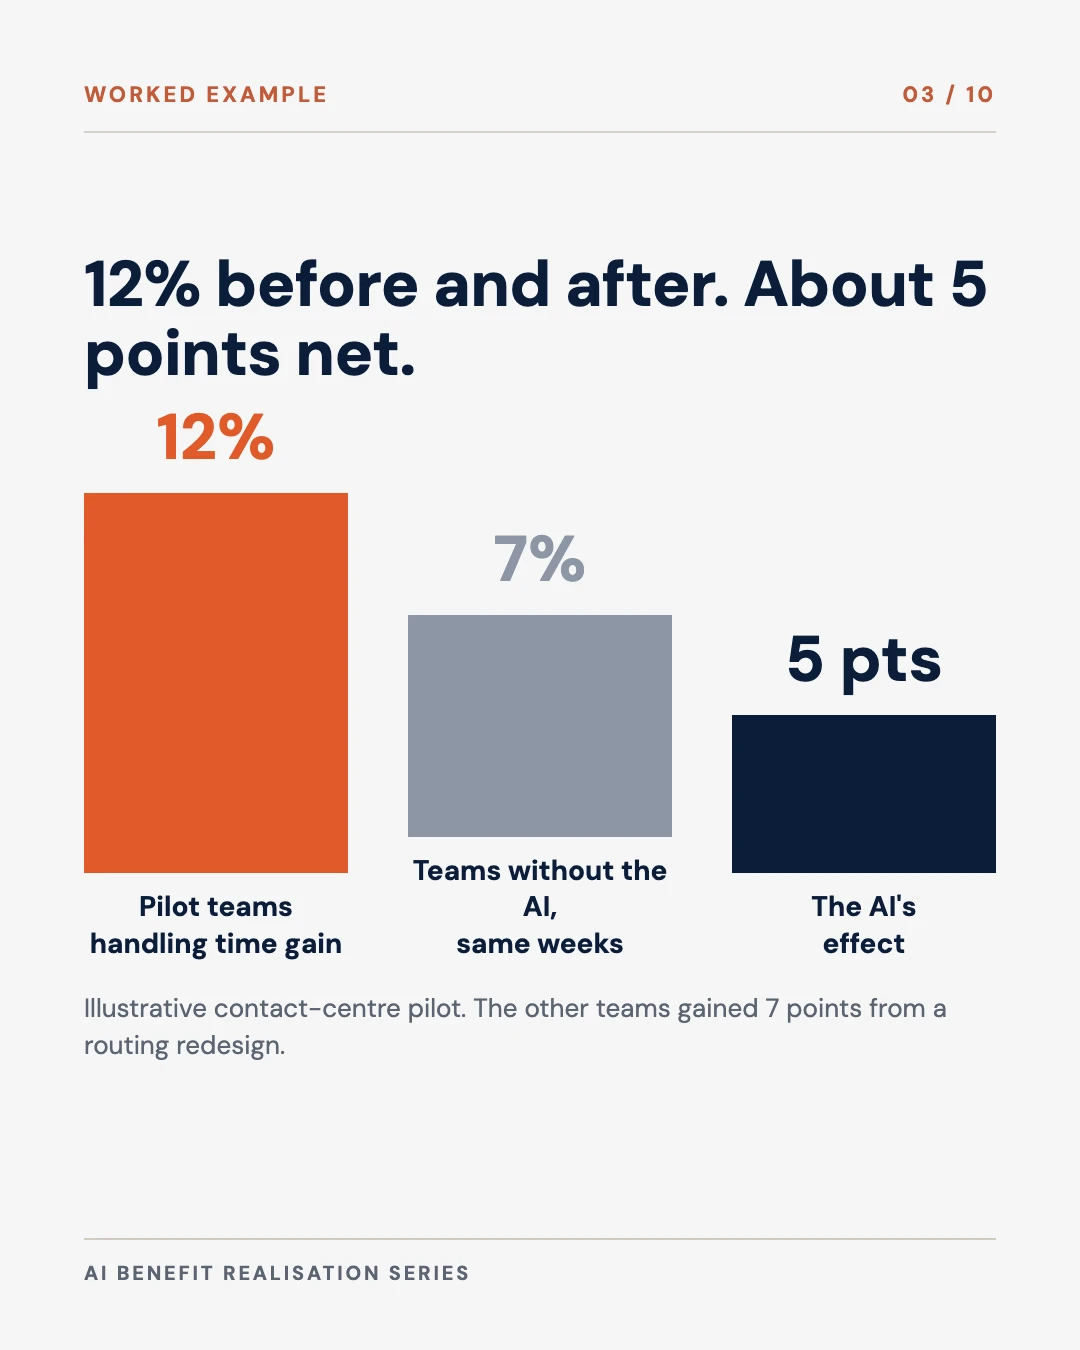
A before-and-after comparison assumes that nothing else changed. In most enterprises that assumption fails within a quarter. The figure below shows a contact-centre pilot in a quarter when the call routing was also redesigned.
One pilot read with and without a comparison group
With a comparison group: teams without the AI fell to 93 over the same weeks, because routing was redesigned that quarter. The AI's effect is the difference, about 5 points.
Illustrative series for a contact-centre pilot, built for this post. The pilot teams' line is identical in both views; only the comparison changes.
Handling time in the pilot teams improved by 12 per cent. Over the same weeks, teams without the AI improved by 7 per cent, because the routing change helped everyone. The AI’s effect is the difference, about 5 points. A business case approved on the 12 per cent would overstate the benefit by more than double, and nobody involved would have done anything dishonest.
Randomised holdout
A randomised holdout keeps a random share of teams, agents, cases or customers without the AI for the length of the pilot. Because chance decides who is held out, the two groups differ only by chance and by the AI, and the difference in outcomes is the effect.
The design decisions are few, and each should be written into the pilot charter.
The unit of randomisation. Randomise at the level where the AI is used and where its effects stay contained. For a drafting assistant that may be the individual. For a tool that changes how a team shares work, it is the team. Kohavi, Tang and Xu’s guide to controlled experiments gives a chapter to leakage and interference between groups. In an enterprise pilot this happens when held-out agents copy the AI’s drafts from colleagues, or when a supervisor moves the hard cases to the AI group. Randomising whole teams or sites prevents most of it.
The size of the holdout. The holdout must be large enough to detect the target. Part 2 gave the rule for working out the smallest change a comparison can detect. A holdout of 10 to 20 per cent of units is common in practice, but the right figure comes from that calculation.
The cost. The held-out group goes without the benefit for the length of the pilot. That forgone benefit is the price of the evidence, and it is usually small next to the cost of scaling a tool on a number that turns out to be wrong.
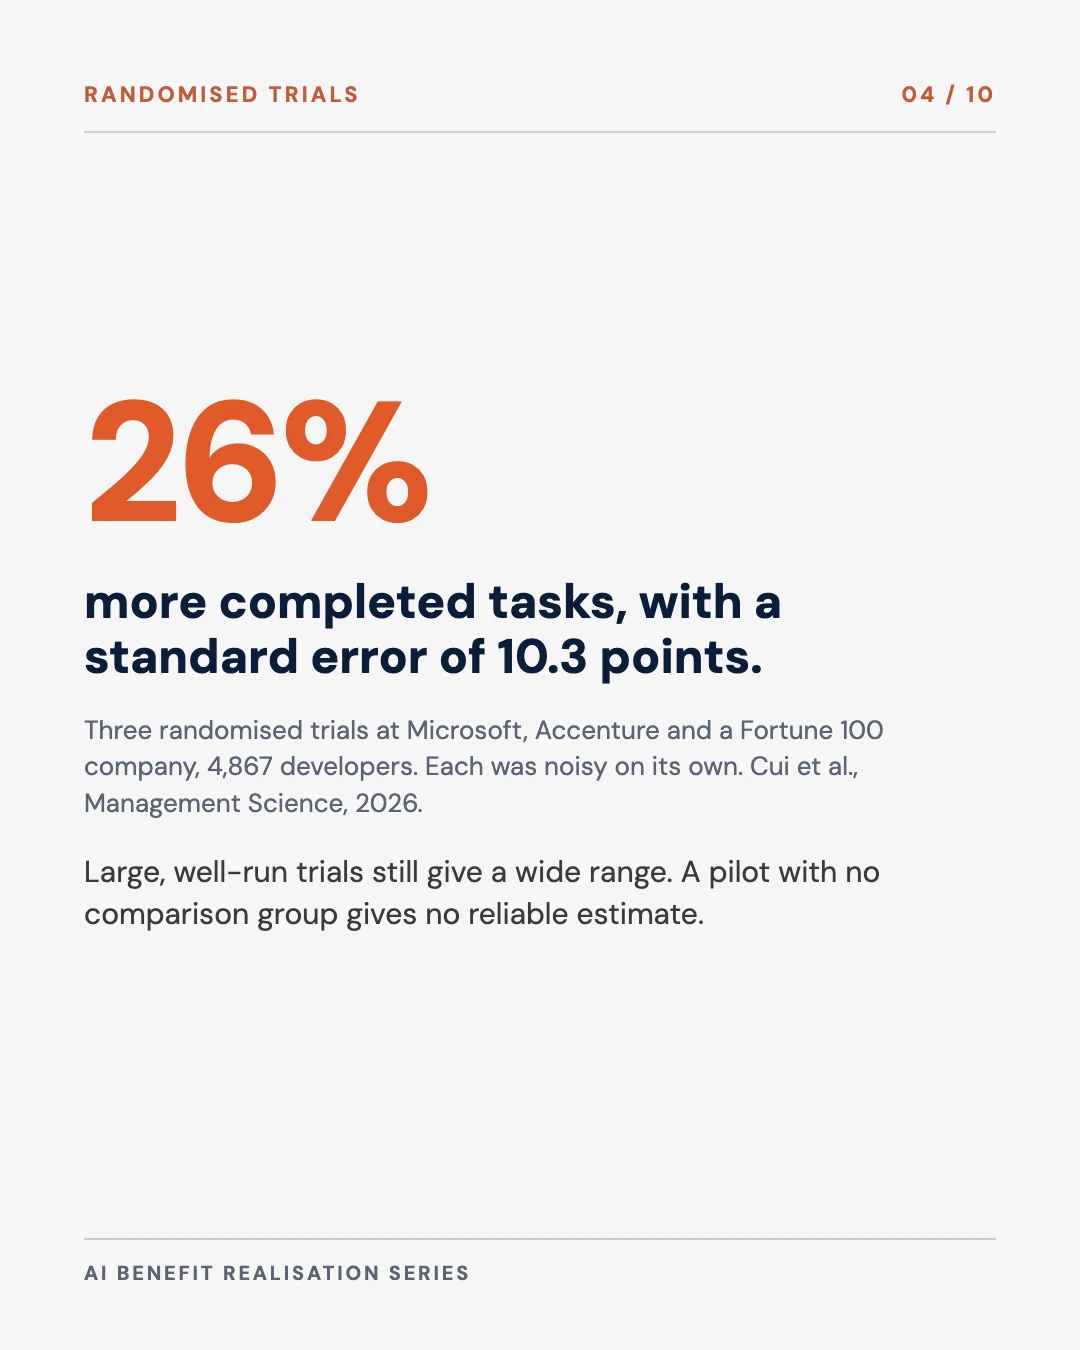
The best published trials show why the comparison group matters. Cui and colleagues pooled three randomised experiments run by Microsoft, Accenture and a Fortune 100 company, covering 4,867 software developers given an AI coding assistant. Completed tasks rose by 26.08 per cent, with a standard error of 10.3 per cent. The authors note that each experiment on its own was noisy. At the usual 95 per cent confidence, that interval runs from roughly 6 to 46 per cent. These were large, well-run trials, and the honest range is still wide. A single-team pilot without a comparison group could not produce a reliable estimate at all.
Randomisation also shows harms that a before-and-after hides. In Dell’Acqua and colleagues’ experiment with 758 Boston Consulting Group consultants, those with AI did better on tasks inside what the authors call the AI frontier, and were 19 per cent less likely to reach a correct answer on a task outside it. A pilot that measured only the tasks the AI handled well would have reported a clean gain.
Book the effect per licence
Not everyone given an AI tool uses it. Dillon, Jaffe, Immorlica and Stanton randomly gave Microsoft 365 Copilot to knowledge workers across 66 firms, 7,137 workers in the latest version of the study. In the second half of the experiment, the 80 per cent of treated workers who used the tool spent about two fewer hours a week on email. The saving applies to the users. The organisation pays for every licence.
The saving per user and per licence
2.0 h
less email a week, per user
1.6 h
per licence paid for, the figure to book
Source: Dillon, Jaffe, Immorlica and Stanton, 2025, 66 firms and 7,137 workers. The per-licence figure is our arithmetic and assumes non-users save nothing.
Statisticians separate the effect of offering a tool, called the intention-to-treat effect, from the effect on those who use it. For a business case the first figure is the one that matters, because the organisation pays per licence and cannot choose its users in advance. If four in five people use the tool and users save two hours, a rough figure per licence is 1.6 hours. The vendor’s case study will usually quote the larger number.
The same logic rules out a common shortcut. Comparing heavy users of an AI tool with light users does not measure the tool. Heavy users chose to use it, and they are often the people who were already faster, more curious or less busy. The difference between the two groups mixes the AI’s effect with the difference between the people. It is useful for deciding where to train, and it should not be booked as a benefit.
Staggered rollout
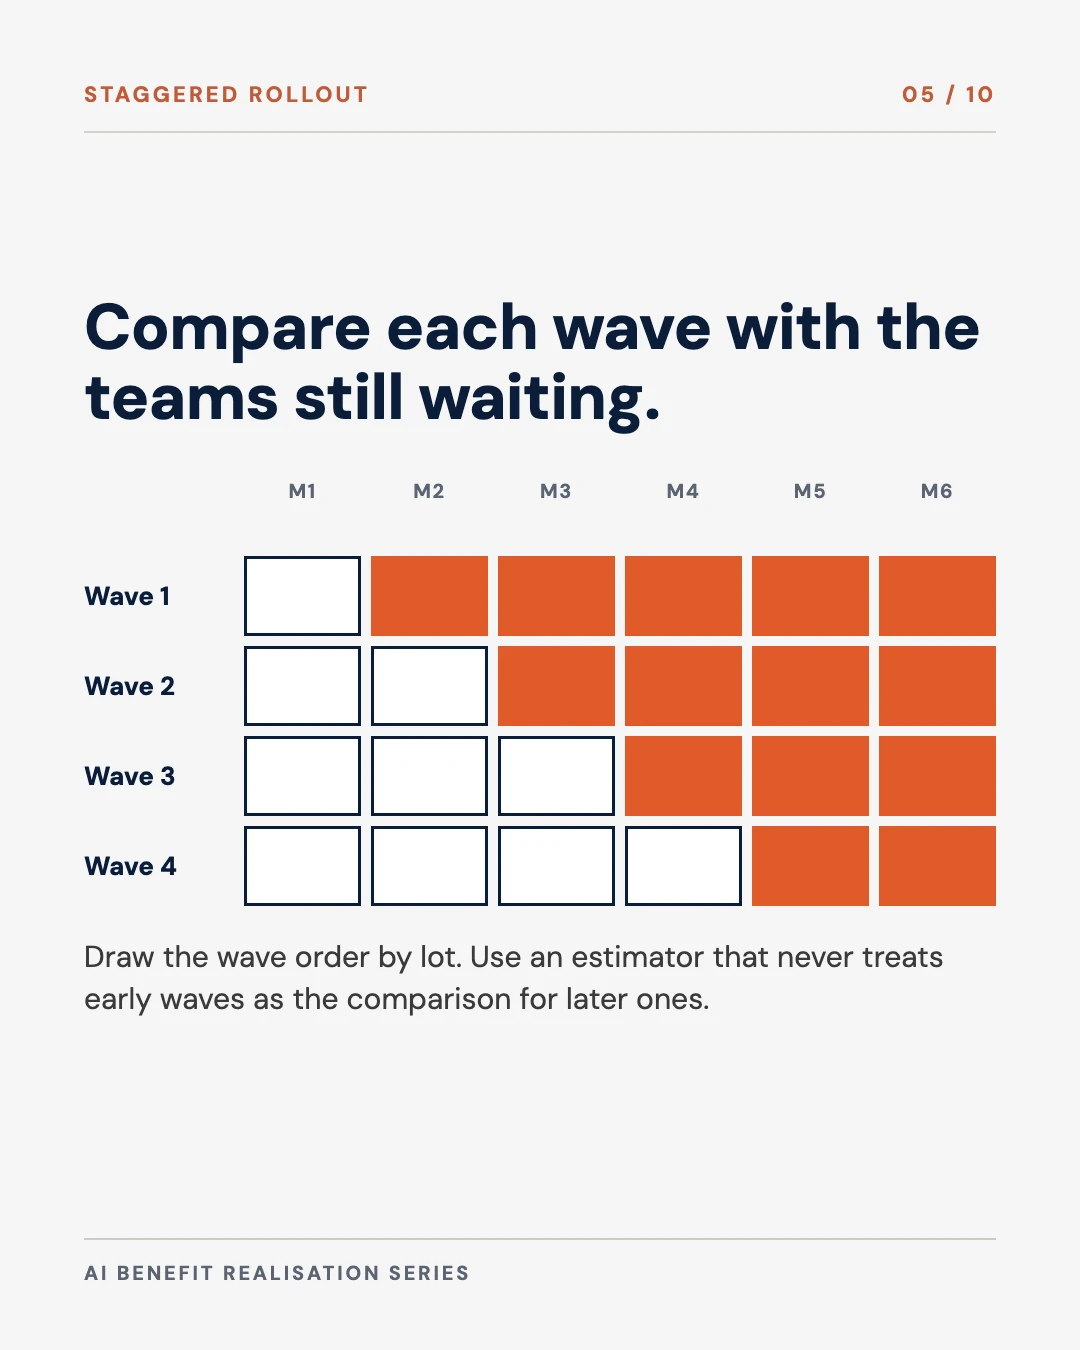
When holding the tool back from some teams for the whole pilot is unacceptable, a staggered rollout is the practical alternative. The AI reaches teams in waves, and each wave is compared with the teams still waiting, using difference-in-differences. Most enterprise rollouts happen in waves anyway, because of training capacity and licence procurement. The extra cost is recording the order and the dates, and agreeing the comparison before the first wave goes live.
Each wave compared with the teams still waiting
Schematic. Draw the wave order by lot, record the go-live dates, and compare each wave only with teams that have not started yet.
Brynjolfsson, Li and Raymond used a staggered rollout to study 5,172 customer-support agents and found productivity rose by 15 per cent on average and by 30 per cent for novice and lower-skilled workers. The design gave a credible estimate without anyone being denied the tool for long.
Two rules make a staggered rollout reliable.
Randomise the order of the waves. If the most enthusiastic team goes first, the first wave’s gain partly reflects the team’s enthusiasm. If the order is drawn by lot, the design becomes what the Magenta Book calls a stepped-wedge trial, a variant of the randomised controlled trial, and it carries nearly the same confidence as a holdout.
Compare only with teams that have not started yet. Difference-in-differences assumes the groups would have moved in parallel without the AI. The Magenta Book states the assumption plainly: that the outcome for both groups “would continue to move in parallel” had the intervention not occurred. The baseline from part 2 is how you check it, because it shows whether the groups tracked each other before the rollout. There is also a technical trap. Goodman-Bacon showed in 2021 that the standard regression used for staggered designs can be biased when the effect changes over time, because teams that started early end up serving as the comparison for teams that started later. AI effects do change over time as people learn the tool. Callaway and Sant’Anna and others have published estimators that avoid the problem by comparing each wave only with teams not yet treated. The analyst does not need to explain the econometrics to the CFO, but the method note in the benefits register should name which estimator was used.
Switchback test
Some AI systems cannot be split by user. A model that routes calls, sets prices, dispatches drivers or allocates stock affects everyone in the queue at once, so a holdout of individual customers would leak. The answer is to randomise by time and place instead. DoorDash’s engineering team described this in 2018 for its dispatch algorithm, using “switchback testing, where we switch back and forth between treatment and control” in particular regions over time.
In an enterprise this means running the AI routing model in some time blocks and the old rules in others, with the schedule drawn at random, across several sites. Each block is short enough to repeat many times, and long enough for the effect of one block not to carry into the next. The number of independent blocks, rather than the number of transactions, decides how small a change the test can detect, so switchbacks need weeks of blocks to give a confident answer.
Synthetic control
When the AI goes live in one unit, such as a single country, a single branch network or a single plant, there is no group of similar units to compare with. Abadie, Diamond and Hainmueller developed the synthetic control method for this case. It builds a weighted combination of untreated units whose history matches the treated unit’s history before the change, and treats that combination as the comparison. Their best-known application estimated that California’s 1988 tobacco control programme reduced annual cigarette sales by about 26 packs per person by 2000, against a synthetic California built from other states. The Magenta Book describes the comparison as a “synthetic clone.”
For an AI rollout in one country of a regional business, the other countries supply the donor pool. The method needs a long, clean history for every unit, which is another reason to record the baseline weekly and at unit level, as part 2 recommended. The weights should be fixed before the results are seen, because a synthetic control chosen afterwards can be made to show almost anything.
Trend-adjusted before and after
Some changes have no possible comparison: an organisation-wide finance assistant, or a new model in a process that only one team runs. The remaining method is a before-and-after comparison corrected for trend and seasonality, known in its stronger form as interrupted time series. It fits the weekly history from before the change, projects it forward, and measures how far the results depart from the projection.
Lopez Bernal, Cummins and Gasparrini’s tutorial on the method sets out what it needs: regular data over a long period before and after, an expected shape of the effect specified in advance, adjustment for seasonality, and attention to other events that change at the same time. That last requirement is where enterprise pilots usually fail, because the reorganisation, the price change and the AI launch are often announced together. Adding a control series, such as a related process the AI does not touch, strengthens the design considerably.
This method gives the lowest confidence of the ones that can be counted. A benefit measured this way should carry its grade in the benefits register and be reported apart from benefits measured with a comparison group, as part 1 set out.
When several changes land at once
A contact centre may deploy an AI assistant, a new knowledge base and a revised incentive scheme in the same quarter. Each sponsor will want the credit. Splitting the total by negotiation is the wrong answer, because every sponsor will then claim the full effect elsewhere.
There are three better options. The first is to sequence the changes and measure each before the next starts. The second is a factorial design, which the Magenta Book lists as a variant of the randomised trial: teams are randomly assigned to the AI, the new knowledge base, both or neither, and each effect is measured separately. The third, where neither is possible, is to report one combined benefit for the package, owned by one sponsor, with no split between the parts. Part 1’s single benefits register is what stops the same saving being claimed twice.
Choosing a method for each use case
The method follows from how the AI is used and how its effects spread. The figure below works through the choice.
Choosing an attribution method
Our proposal, schematic. Answer the questions in order; a "no" moves to the next one. Write the result into the pilot charter before the first production model call.
| Use case | Unit of comparison | Recommended method | Fallback |
|---|---|---|---|
| Drafting assistant for relationship managers | Individual or team | Randomised holdout | Staggered rollout with randomised wave order |
| Contact-centre agent assistant | Team or site | Staggered rollout with randomised wave order | Matched comparison of similar sites |
| Call routing or pricing model | Site and time block | Switchback test | Trend-adjusted before and after with a control series |
| Claims triage in one country of a regional insurer | Country | Synthetic control from the other countries | Trend-adjusted before and after |
| Organisation-wide finance close assistant | The whole organisation | Trend-adjusted before and after | Report as capacity, graded low |
Our examples. The recommended method is the strongest the use case usually allows; the fallback applies when the first is impractical.
What each method costs
Each method has a cost, and finance should see it at approval alongside the pilot budget.
| Method | What it needs | Main cost | Grade it supports |
|---|---|---|---|
| Randomised holdout | Random assignment, a holdout large enough to detect the target | Benefit forgone by the holdout during the pilot | Highest |
| Staggered rollout, randomised order | Waves of similar size, order drawn by lot, dates recorded | Later waves wait; analyst time for a modern estimator | High |
| Switchback test | A system that can switch on and off by time block | Weeks of blocks to reach enough independent units | High |
| Synthetic control | Long unit-level history for the treated unit and donors | Data preparation; weights fixed in advance | Moderate |
| Matched comparison | Comparable units chosen before the pilot | Risk that the groups differ in ways nobody measured | Moderate |
| Trend-adjusted before and after | A long, regular weekly history; impact model specified in advance | Confounding by anything else launched at the same time | Low |
Our assessment, drawing on the Magenta Book’s annex on analytical methods and the studies cited in this post. Self-reported estimates are left out because they are not counted as realised benefits.
The table changes one habit. A pilot sponsor who asks for a holdout to be waived should be asked what the alternative method is and what grade it supports, and that answer goes into the charter. A waiver does not make the evidence requirement go away.
When no comparison is possible
Some benefits cannot be measured to a standard finance would accept. The process is unique, the history is short and everything changed at once. In that case there are three honest options: report the result as capacity rather than cash, grade it low and keep it apart from measured benefits, or record that the benefit was not measurable. Part 1 made that last outcome a kill criterion. It is a legitimate finding, and reaching it at approval costs less than defending a weak number to an audit committee later.
One example from Singapore shows what this looks like when it is done properly. DBS, which reports about S$1 billion in economic value from data analytics and AI, measures each use case against a control group that did not get the AI. We looked at what that figure measures and how a board should read it in an earlier post. It is the clearest local evidence that a comparison group for every use case is practical at the scale of a large bank.
What to do before the next pilot
- Write the method into the charter. Name the method, the unit of comparison, the estimator and the grade it supports before the first production model call.
- Default to a holdout or a randomised rollout order. Ask for a written reason, and the alternative’s grade, whenever neither is used.
- Book the effect per licence. Report the intention-to-treat figure in the business case, and the effect on users only as supporting detail.
- Ban user-versus-non-user comparisons as benefits. Use them to plan training, never to book a saving.
- Sequence or factorialise overlapping changes. Where neither is possible, report one combined benefit with one owner.
- Fix the comparison before results exist. That covers donor weights for a synthetic control, the impact model for a trend-adjusted comparison and the wave order for a rollout.
Questions to ask before accepting a claimed benefit
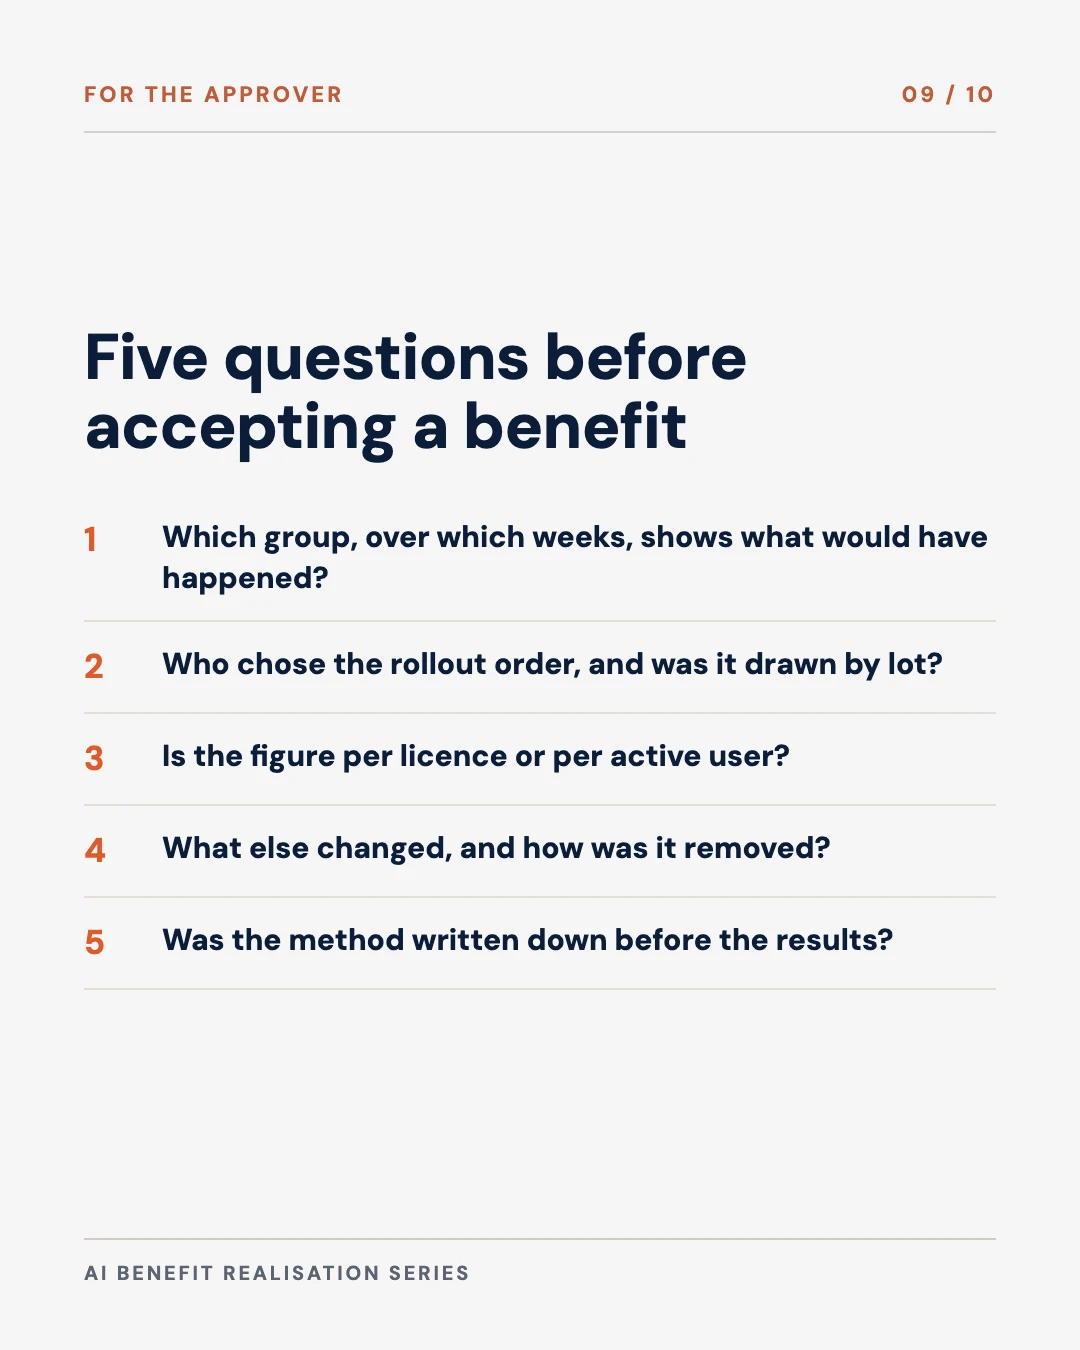
- What would have happened without the AI, and which group over which weeks tells us that?
- Who decided which teams got the AI first, and was the order drawn at random?
- Is this figure per licence paid for, or per active user?
- What else changed in the same weeks, and how was its effect removed?
- Was the method written down before the results came in?
Free tool
AI Value Ledger
Grade each AI use case by the method behind its benefit, and see the board figure built only from benefits that carry a comparison group.
Part 4 turns to the other side of the ledger: the running cost of AI, tagged to the use case that incurred it, so that a benefit measured this way can be set against a cost measured with the same care. The series page lists what is planned.
Evidence & Methodology
Study results and guidance text come from the publishers’ own pages and documents, read in October 2026. Where a study has several versions, we used the latest: the November 2025 revision of Dillon et al. and the Management Science version of Cui et al. The worked examples, the use-case table, the cost table and the method chooser are our own proposal, and the figures in them are illustrative.
| Claim | Source | Grade |
|---|---|---|
| Magenta Book lists RCTs (including factorial and stepped-wedge), difference-in-differences, synthetic control and interrupted time series; parallel-trends wording; “synthetic clone” | HM Treasury, Magenta Book Annex A, May 2026 update | Measured, government guidance |
| 26.08% more completed tasks, standard error 10.3%, 4,867 developers, three RCTs, each noisy alone | Cui, Demirer, Jaffe, Musolff, Peng and Salz, Management Science, 2026 | Measured, randomised experiments |
| Interval of roughly 6% to 46% | Our arithmetic from the published estimate and standard error | Adapted |
| 758 consultants; 19% less likely correct outside the frontier | Dell’Acqua et al., Organization Science, 2026 | Measured, randomised experiment |
| 66 firms, 7,137 workers; the 80% who used the tool spent about two fewer hours a week on email | Dillon, Jaffe, Immorlica and Stanton, arXiv 2504.11436 v4, November 2025 | Measured, randomised field experiment |
| 1.6 hours per licence | Our arithmetic, assuming non-users save nothing | Illustrative |
| 5,172 agents, staggered rollout, 15% average, 30% for novices | Brynjolfsson, Li and Raymond, Quarterly Journal of Economics, 2025 | Measured, staggered rollout |
| Standard staggered regression can be biased when effects change over time | Goodman-Bacon, Journal of Econometrics, 2021 | Measured, methods literature |
| Estimators that compare each wave only with not-yet-treated units | Callaway and Sant’Anna, Journal of Econometrics, 2021 | Measured, methods literature |
| Leakage and interference between groups | Kohavi, Tang and Xu, Trustworthy Online Controlled Experiments, 2020 | Measured, methods literature |
| Switchback testing for dispatch | Kastelman and Ramesh, DoorDash Engineering, 2018 | Reported, company engineering blog |
| Synthetic control; California, about 26 packs per person by 2000 | Abadie, Diamond and Hainmueller, JASA, 2010 | Measured, methods literature |
| Interrupted time series requirements | Lopez Bernal, Cummins and Gasparrini, International Journal of Epidemiology, 2017 | Measured, methods literature |
| DBS measures each use case against a control group | Our earlier review of DBS’s 2025 annual report | Reported, company disclosure |
| 12% before-and-after against 5 points net of comparison | Illustrative example built for this post | Illustrative |
| Holdouts of 10 to 20% are common; method costs and grades; use-case table | Our practice and judgement | My call |
Sources
- HM Treasury. (2026). Magenta Book Annex A: analytical methods for use within an evaluation.
- Cui, K.Z., Demirer, M., Jaffe, S., Musolff, L., Peng, S., and Salz, T. (2026). The effects of generative AI on high-skilled work: evidence from three field experiments with software developers. Management Science.
- Dell’Acqua, F., et al. (2026). Navigating the jagged technological frontier. Organization Science, 37(2), 403-423.
- Dillon, E.W., Jaffe, S., Immorlica, N., and Stanton, C.T. (2025). Shifting work patterns with generative AI. arXiv 2504.11436.
- Brynjolfsson, E., Li, D., and Raymond, L. (2025). Generative AI at work. Quarterly Journal of Economics, 140(2), 889-942.
- Goodman-Bacon, A. (2021). Difference-in-differences with variation in treatment timing. Journal of Econometrics, 225(2), 254-277.
- Callaway, B., and Sant’Anna, P.H.C. (2021). Difference-in-differences with multiple time periods. Journal of Econometrics, 225(2), 200-230.
- Kohavi, R., Tang, D., and Xu, Y. (2020). Trustworthy online controlled experiments: a practical guide to A/B testing. Cambridge University Press.
- Kastelman, D., and Ramesh, R. (2018). Switchback tests and randomized experimentation under network effects at DoorDash. DoorDash Engineering.
- Abadie, A., Diamond, A., and Hainmueller, J. (2010). Synthetic control methods for comparative case studies: estimating the effect of California’s tobacco control program. Journal of the American Statistical Association, 105(490), 493-505.
- Lopez Bernal, J., Cummins, S., and Gasparrini, A. (2017). Interrupted time series regression for the evaluation of public health interventions: a tutorial. International Journal of Epidemiology, 46(1), 348-355.

Setting the Baseline Before an AI Pilot Starts
The weekly, unit-level history every comparison method in this part depends on.

A Joint CFO–CAIO Framework for AI Benefit Realisation
The four controls, the benefits register and the kill criteria that use the method chosen here.

What DBS's S$1 Billion in AI Value Measures, and How a Board Should Read It
A bank that measures every use case against a control group.

Why Large Enterprises Are Deploying AI at Scale but Measuring It Incorrectly
The measurement mistakes a comparison group is designed to catch.
My thanks to Dr. Christina Chua for co-writing this post and the series. Her view of how finance teams book and review a claimed benefit shaped the sections on booking the effect per licence, what each method costs and what to do when no comparison is possible. Christina is Director, Institutional Sales at Moomoo Financial Singapore. The post does not discuss Moomoo, and the views in it are not Moomoo’s.
If your organisation is about to approve an AI pilot and wants the attribution method agreed before the results come in, that is a short piece of work I often start with. My consulting work covers AI governance and investment oversight for boards, finance leaders and public agencies.