
Executive Summary
DBS Bank reported about S$1 billion in economic value from data analytics and AI/ML in 2025, from more than 2,000 models across over 430 use cases. The number is widely repeated as savings, and in US dollars. It is neither. DBS defines economic value as three things added together: extra revenue, cost avoidance and productivity, and losses averted from fraud and scams. It measures each use case against a control group that did not get the AI treatment. The figure appears in the narrative part of the annual report, outside the audited financial statements, and no per-use-case breakdown is published. It is still one of very few AI value figures any bank has published. A board quoting its own should hold it to the same standard.
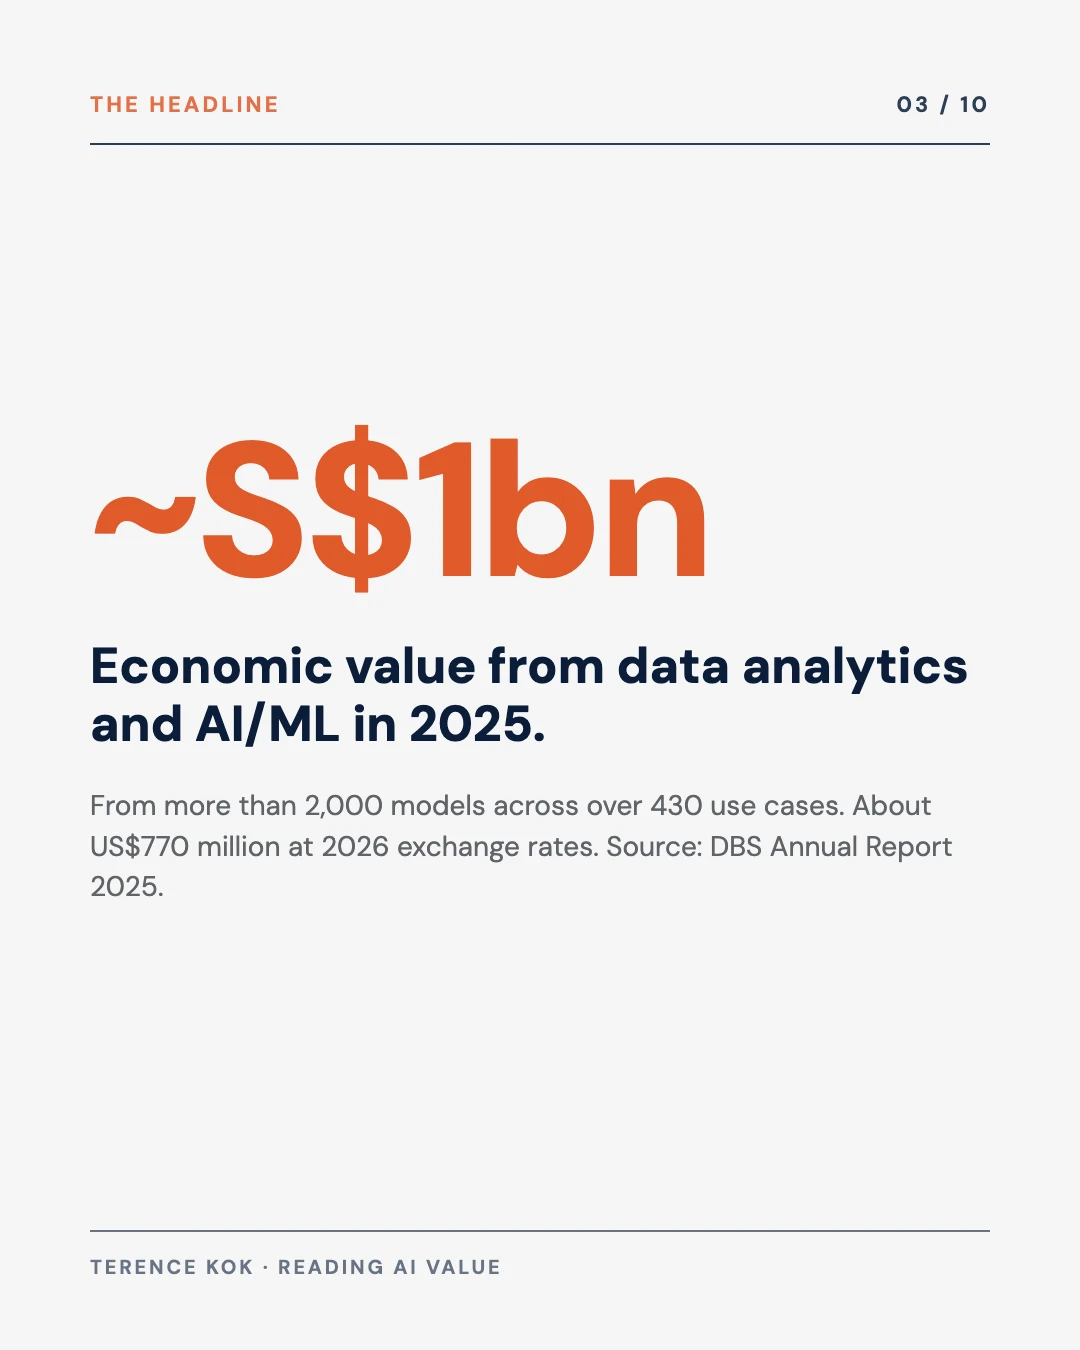
~S$1bn
economic value from data analytics and AI/ML in 2025, DBS Annual Report 2025
2,000+
AI/ML models in production across more than 430 use cases in 2025, DBS Annual Report 2025
S$180m
economic value in 2022, the first year DBS put a number on it, restated from S$150m of revenue uplift
2
banks in the 2024 Evident AI Index that published a total realised value from AI: DBS and JPMorgan Chase
Core conclusions
- The S$1 billion is economic value: revenue uplift, cost avoidance and productivity, and losses averted, added together. Reporting it as savings overstates one component and hides the other two.
- The measurement method is sound. Each use case is compared against a control group, and the difference is what DBS counts. The result is still self-reported and unaudited, and the definition changed once.
- A board should not quote an AI value figure of its own until the definition, the method, the owner of each number and any restatement are written down and reviewed by someone outside the team that built the models.
The argument, in ten slides
Save it, or send it to whoever writes your AI section of the annual report.
What DBS reported
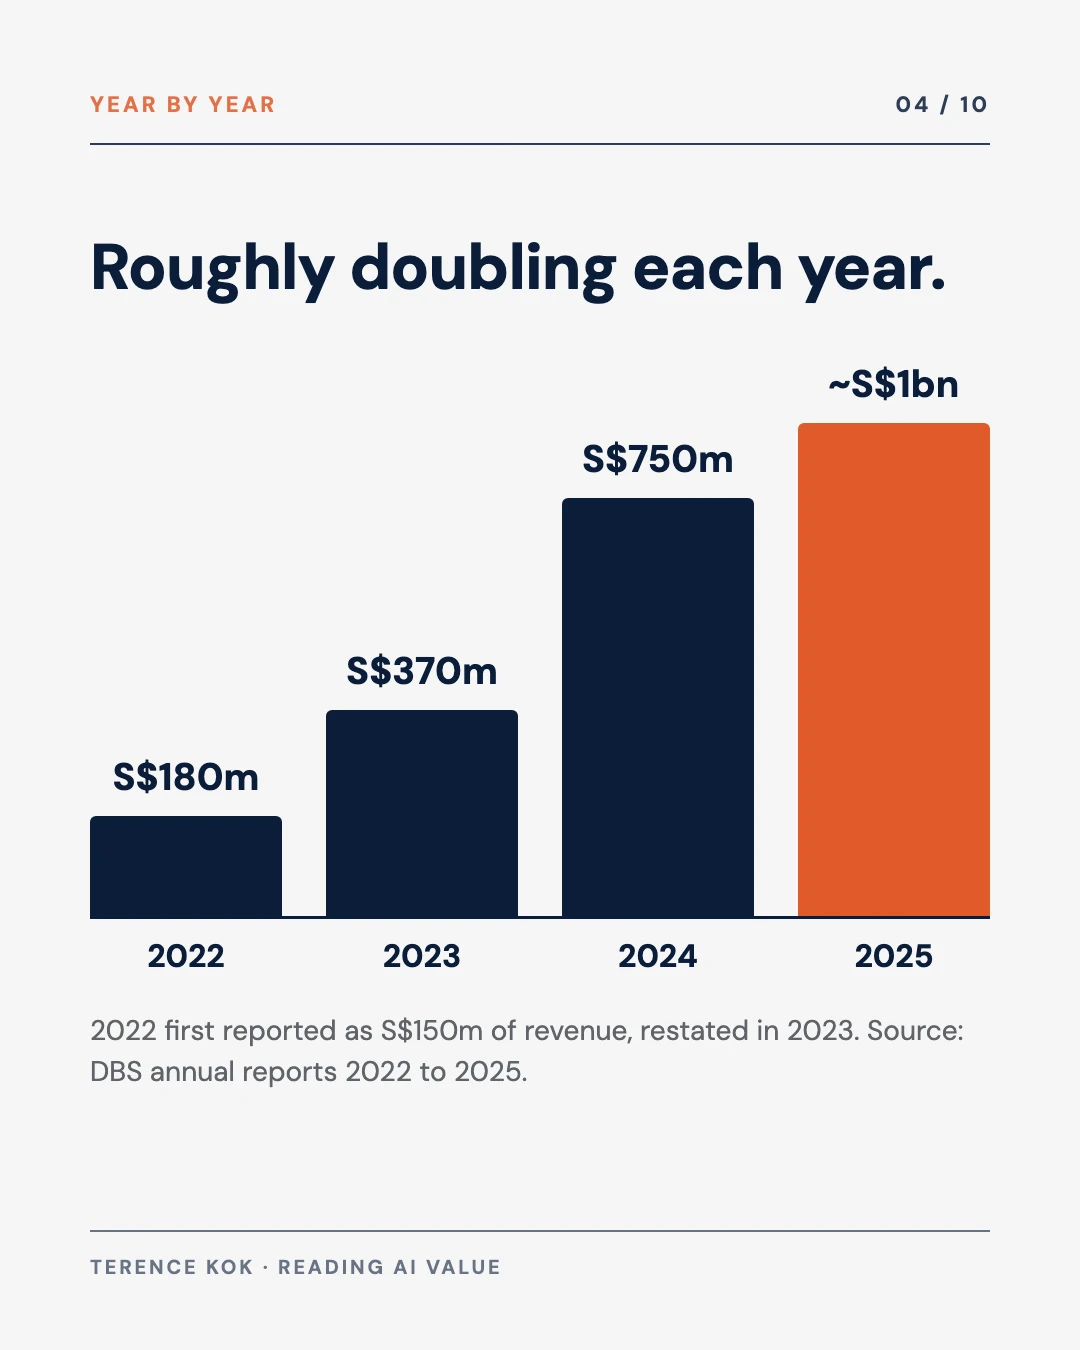
DBS first put a figure on AI in its 2022 annual report: a revenue uplift of about S$150 million from AI/ML, more than double the year before, with an aspiration to reach S$1 billion within five years. In 2023 the bank restated 2022 as S$180 million of economic value, made up of the S$150 million of revenue and S$30 million of cost avoidance and productivity gains. From then on the figure roughly doubled each year.
| Year | Reported value | Models | Use cases | Source |
|---|---|---|---|---|
| 2022 | S$180m (first reported as S$150m revenue) | 600+ | 260 | Annual Report 2022; DBS, August 2023 |
| 2023 | S$370m | 800 | 350 | Annual Report 2023 |
| 2024 | S$750m | 1,500+ | 370+ | Annual Report 2024 |
| 2025 | About S$1bn | 2,000+ | 430+ | Annual Report 2025 |
All figures are DBS’s own, in Singapore dollars, as stated in the narrative sections of the annual reports. The 2025 figure is described as “approximately SGD 1 billion”.
From S$180 million in 2022 to about S$1 billion in 2025.
Economic value from data analytics and AI/ML, as DBS reported it. 2022 is the restated figure (first reported as S$150m of revenue). Model counts from the same annual reports. DBS’s own unaudited measure, taken by test and control.
The 2025 number did not appear in the February 2026 full-year results statement. It appeared in the annual report published in March, and was picked up by The Edge Singapore on 9 March. At 2026 exchange rates it is about US$770 million. It is not US$1 billion, and it is not savings.
What DBS counts as economic value
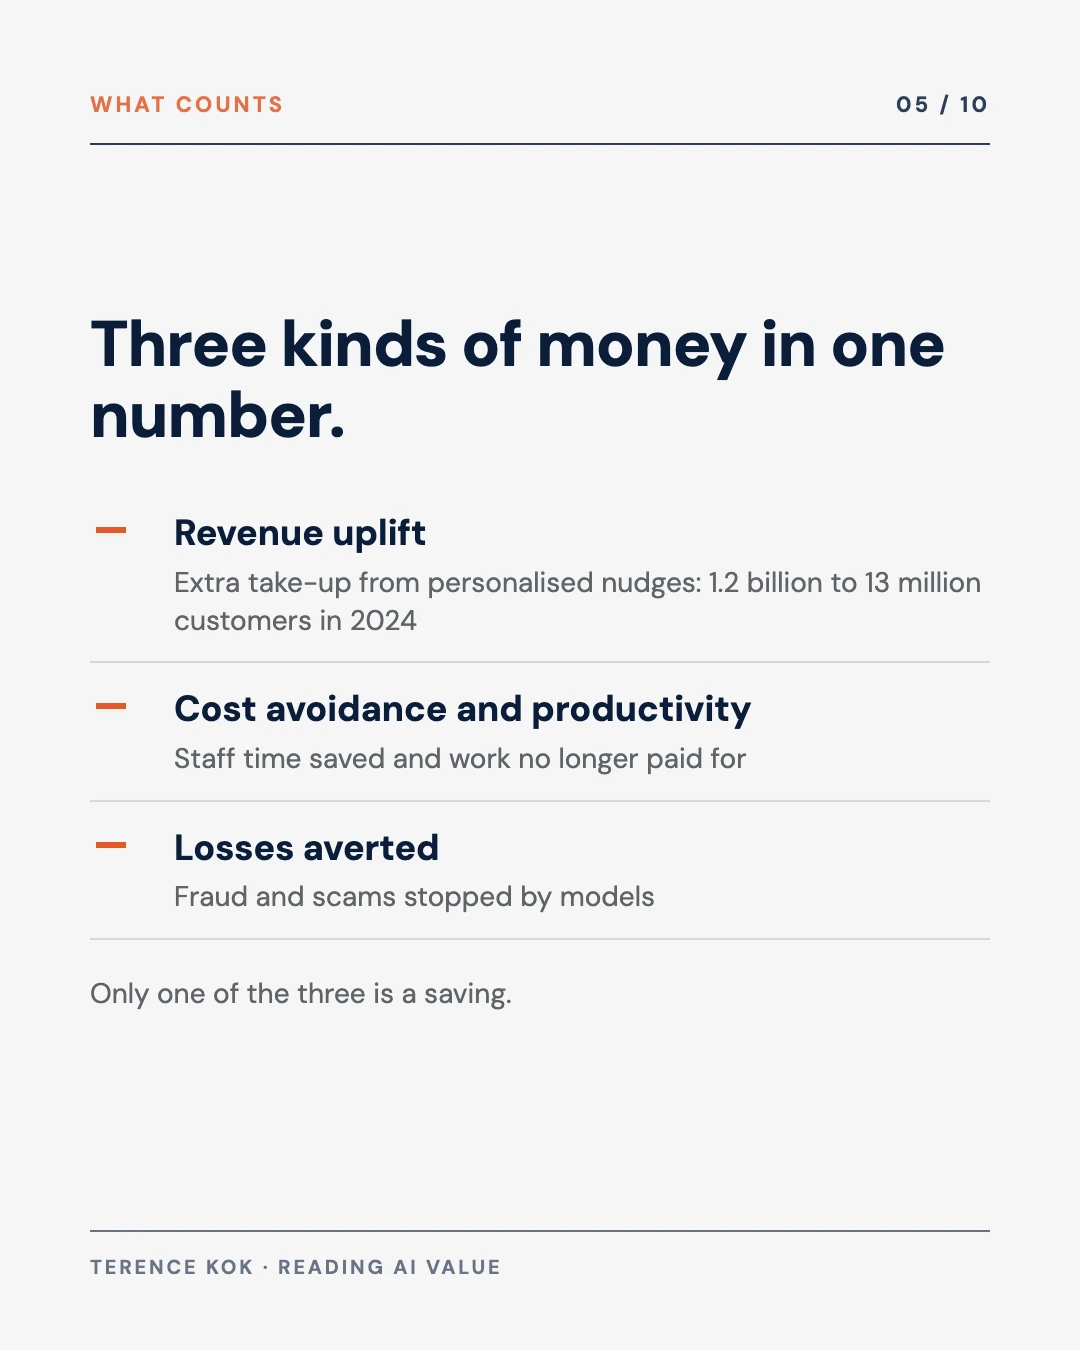
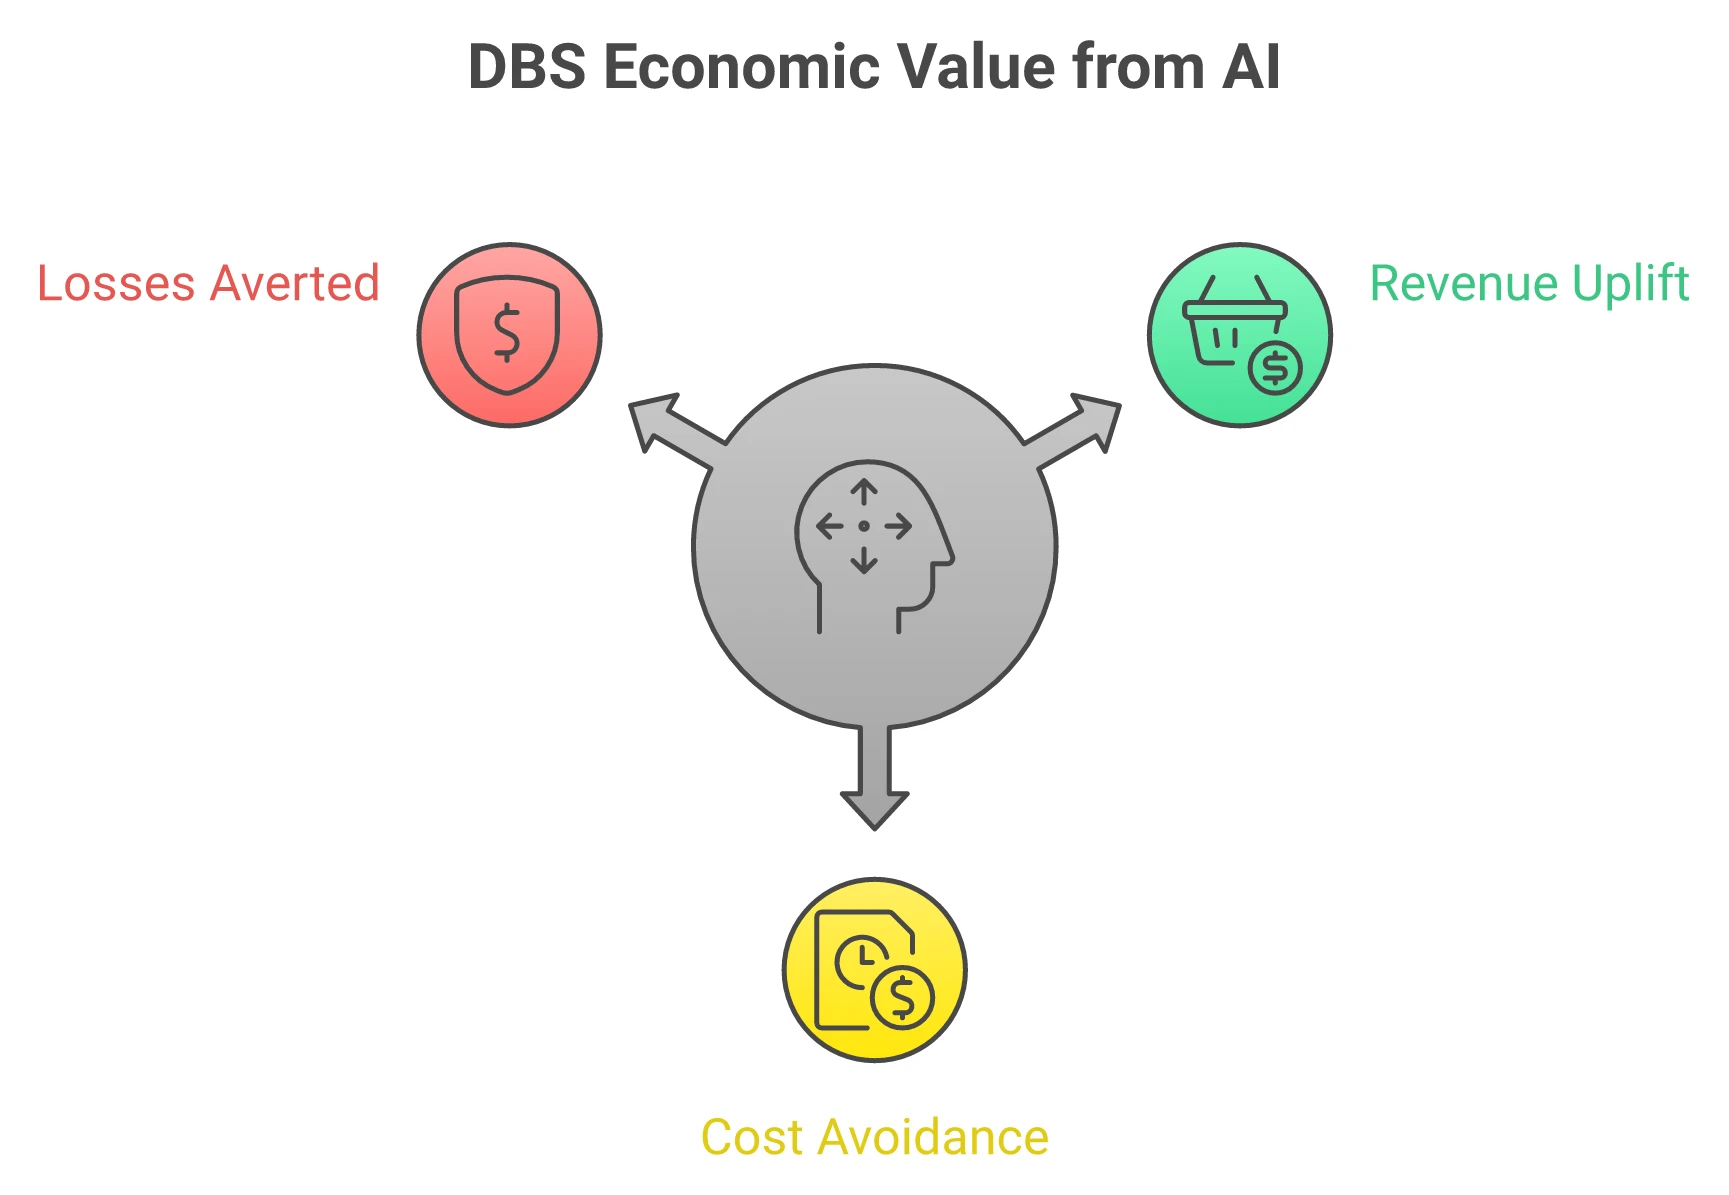
The 2023 annual report describes the value as “incremental revenue from anticipating customers’ needs and serving them better, losses averted from scams and fraud, and productivity gains.” Three different kinds of money sit inside one number.
Revenue uplift was the largest component in 2022, the only year DBS published the split. Much of it comes from personalisation: DBS sent more than 1.2 billion personalised nudges to over 13 million customers in 2024, and the value is the extra product take-up those nudges produce. Cost avoidance and productivity covers staff time saved and work the bank no longer pays for. Losses averted covers fraud and scams stopped by models that would otherwise have got through.
A board that reads “S$1 billion of AI savings” in a newspaper and asks its CFO for the equivalent is asking for a different thing. Most organisations that try to match the headline will find their own number is mostly productivity estimates, the component that is hardest to bank.
How DBS measures it
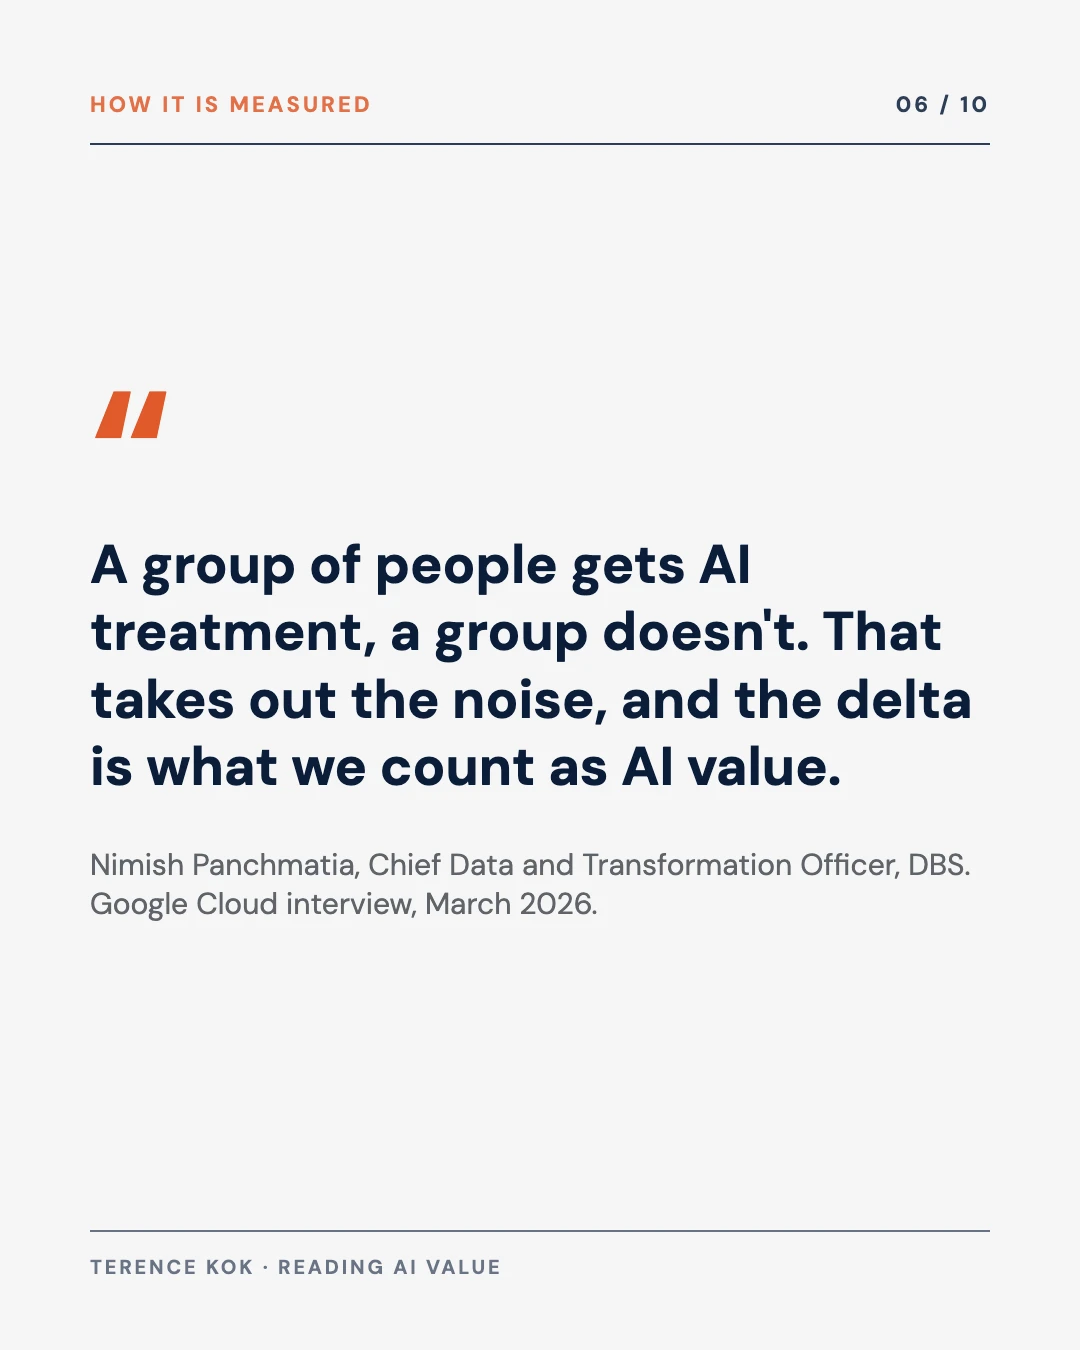
Nimish Panchmatia, DBS’s Chief Data and Transformation Officer, described the method in March 2026: “A large part is test and control. A group of people gets AI treatment, a group doesn’t. That takes out the noise, and the delta is what we count as AI value.”
That is the right method. A control group separates what the model did from what the market, the season or a pricing change would have done anyway. It also forces every use case to have a business owner who agrees what outcome is being measured before the model goes live. At DBS that owner already exists: since 2018 each platform has been led jointly by a business lead and a technology lead on a shared scorecard, which is how value gets booked to a use case at all. The full sequence behind that is set out in the DBS case study.
What the figure leaves out
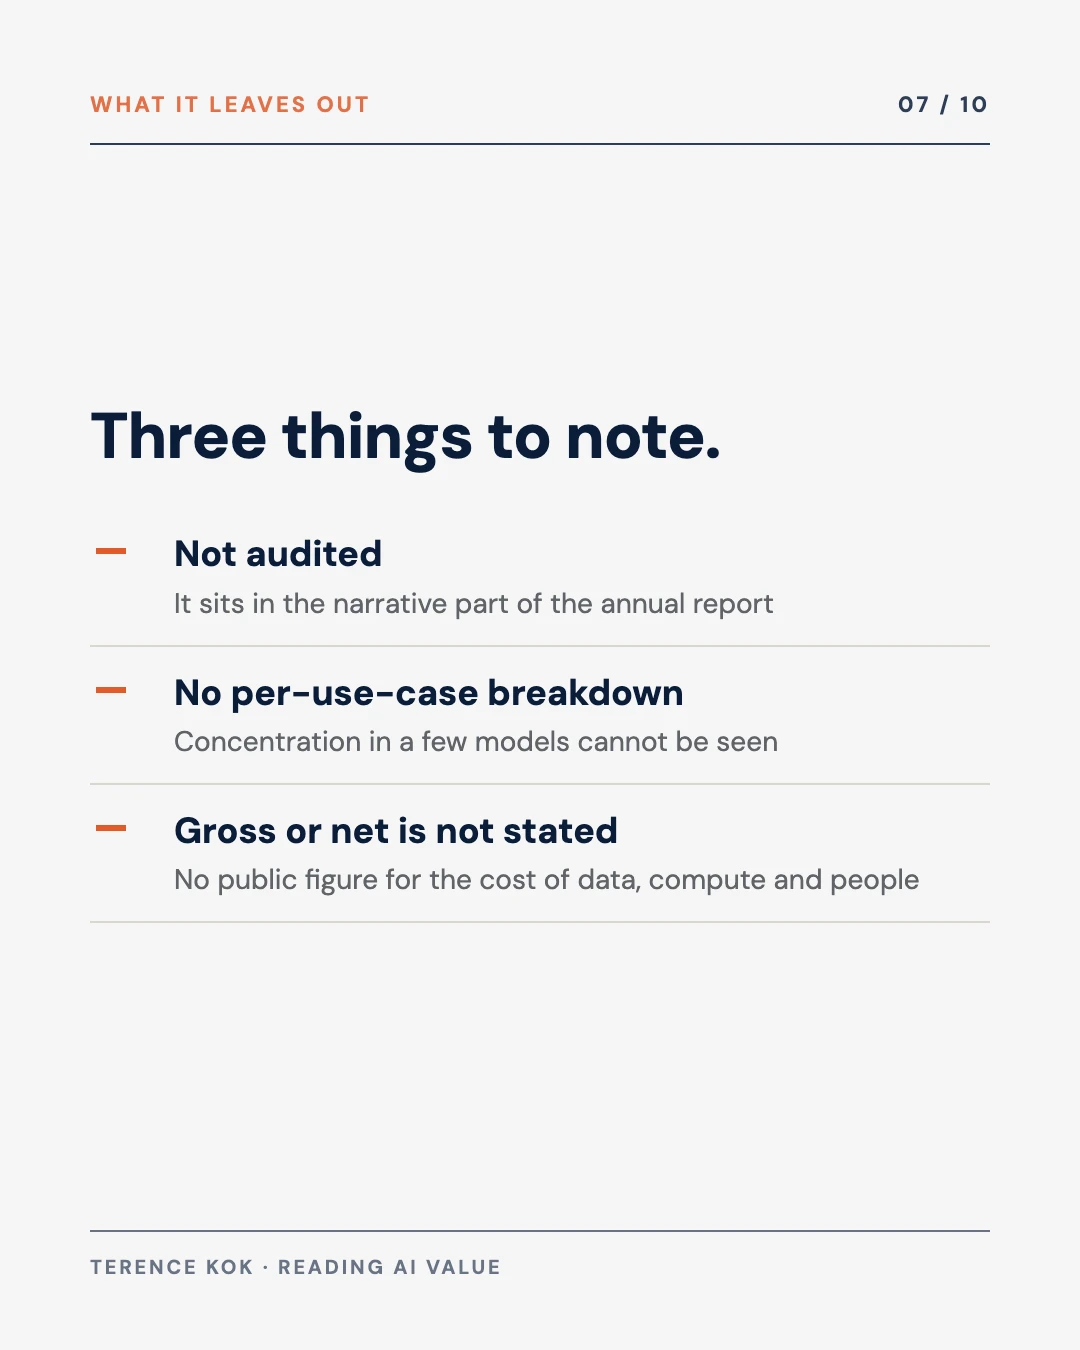
Three things a careful reader should note.
The figure is not audited. It sits in the narrative part of the annual report, outside the financial statements the auditors sign.
No per-use-case breakdown is published. A reader cannot tell whether the S$1 billion comes from a handful of large models or is spread across hundreds of use cases.
I found no public statement on whether the figure is net of what it costs to build and run the models. Gross and net can differ by a wide margin once data, compute and people are counted.
None of this makes the number wrong. The 2024 Evident AI Index noted that DBS was one of only two banks, with JPMorgan Chase, to publish a total realised value from AI at all. By the 2025 index the number reporting realised returns had risen to four, which is still a small minority of the 50 banks Evident tracks. How DBS compares with eight peers is set out in the case study’s peer table.
The target moved
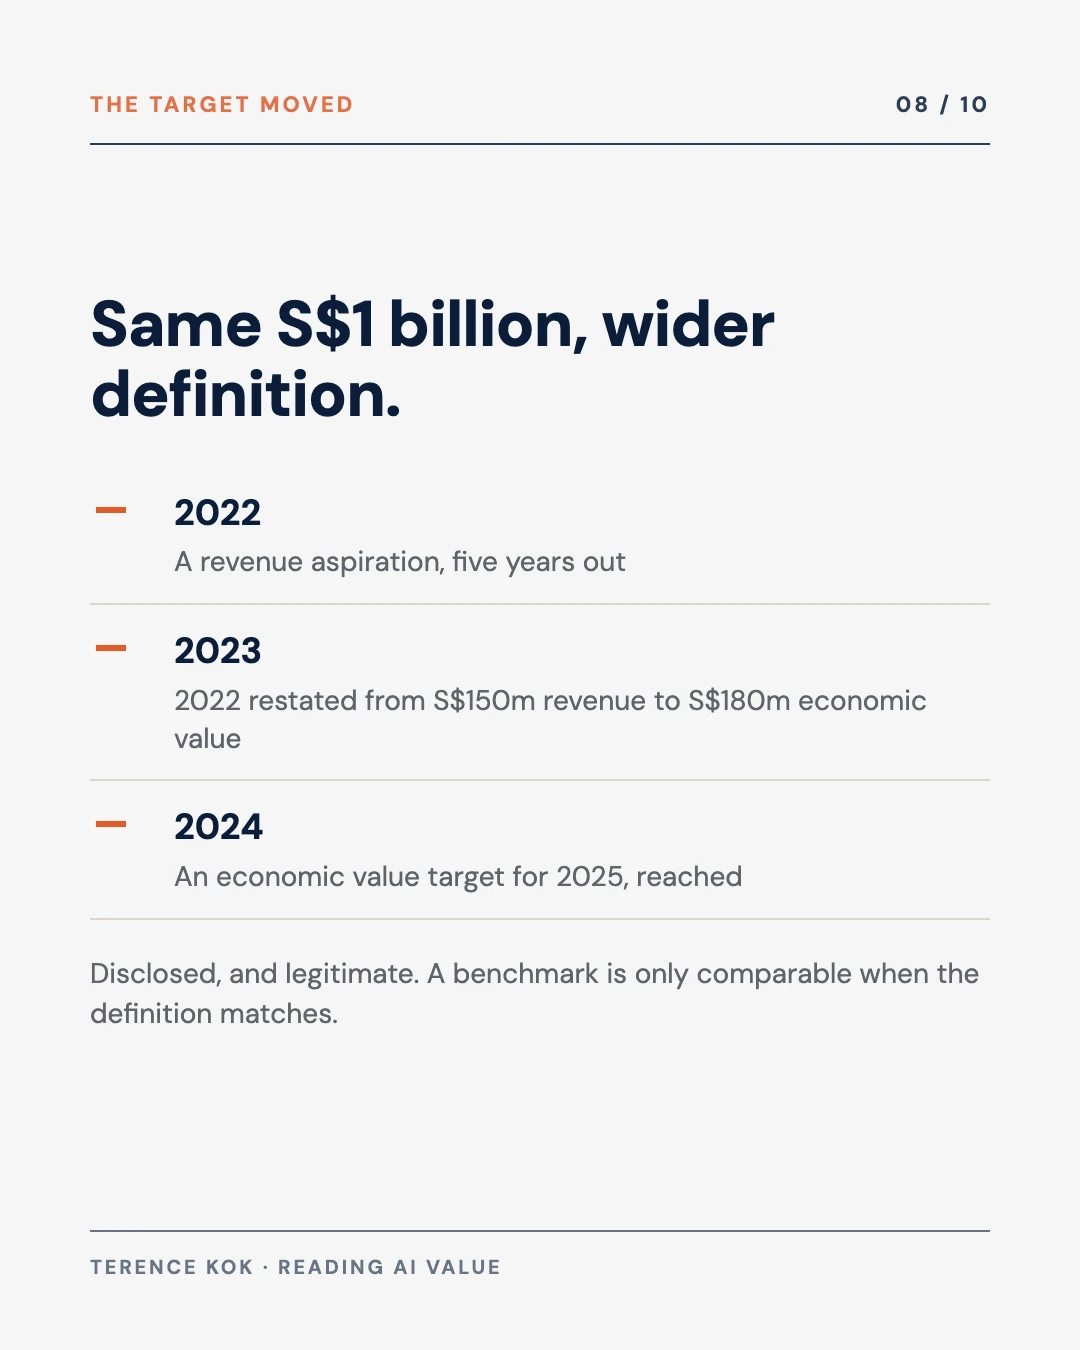
In the 2022 annual report the S$1 billion was a revenue aspiration five years out. By September 2024 it had become an economic value target for 2025, and the 2022 base had been restated from S$150 million of revenue to S$180 million of economic value. DBS reached the target two years ahead of the original timeline, against a broader definition than the one it started with.
Growing a definition is legitimate when it is disclosed, and DBS disclosed it. The lesson for anyone benchmarking against the figure is that a number is only comparable when the definition is the same.
Free tool
How Far Is Your Organisation From DBS?
Score your organisation on the nine capabilities DBS built before its AI paid off, and see which gap to close first.
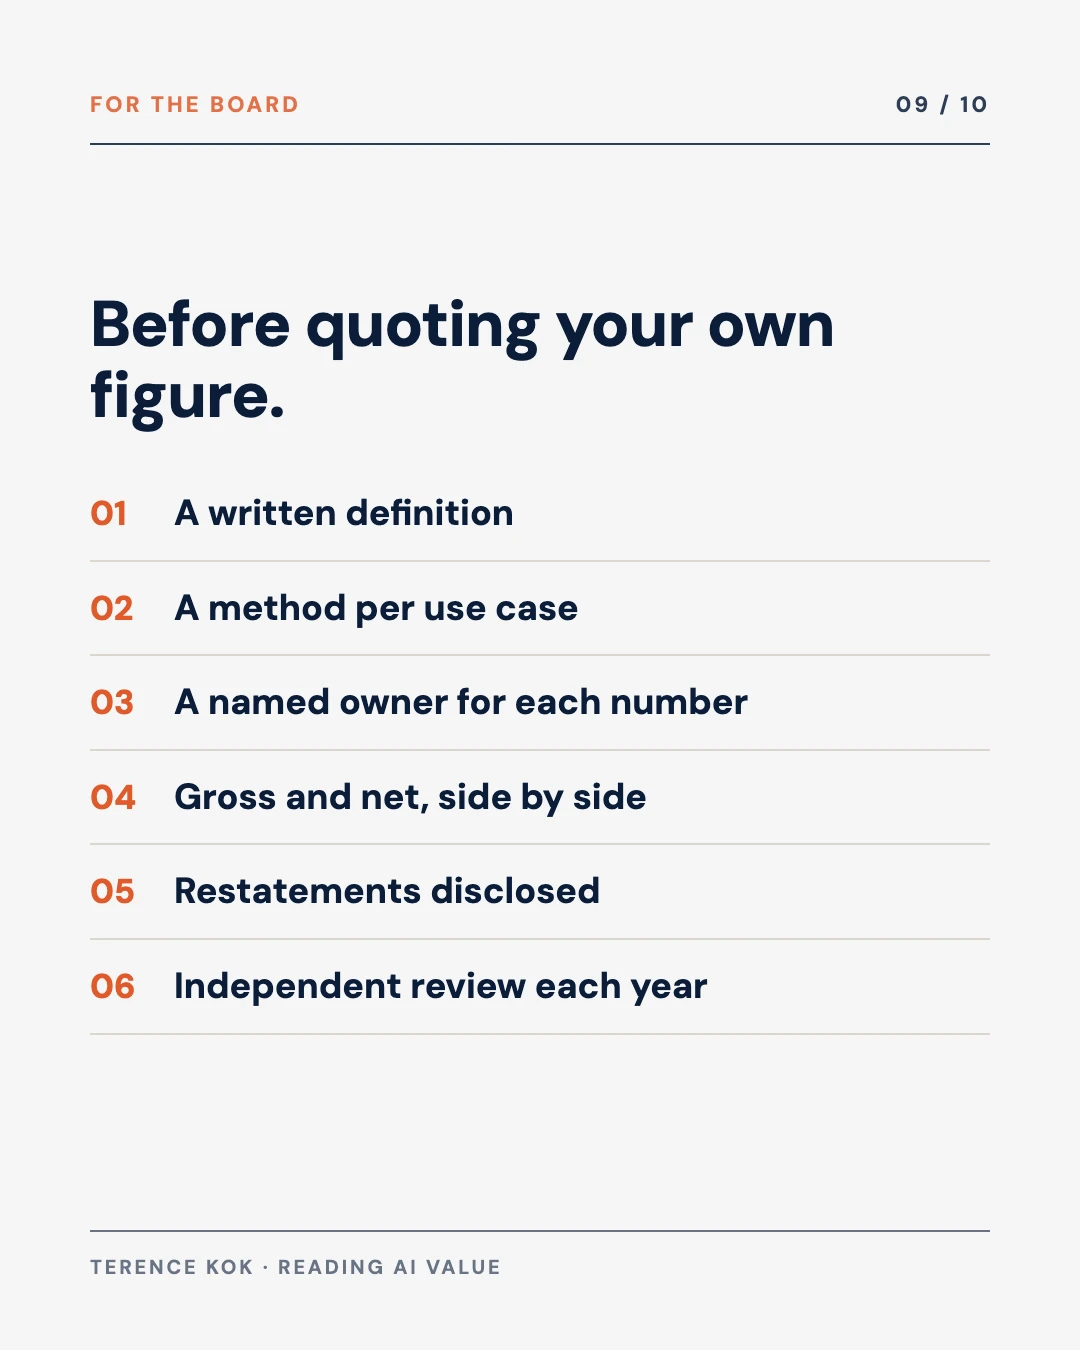
What a board should demand before quoting its own figure
| Demand | What it means in practice |
|---|---|
| A written definition | Which components count (revenue, cost, losses averted), agreed before the first number is produced |
| A method per use case | A control group where one is possible, a documented baseline where it is not, with the choice recorded |
| A named owner for each number | The business lead accountable for the outcome signs the value claimed for their use case |
| Gross and net | Value reported alongside the cost of data, compute, licences and people |
| Restatements disclosed | Any change to the definition or a prior year shown with the old and new figures side by side |
| Independent review | Internal audit, or a party outside the team that built the models, tests a sample of claims each year |
DBS’s public disclosures show the first, second and fifth. The others are not visible from outside.
Evidence & Methodology
Almost every number in this post is DBS’s own. That makes it authoritative on what DBS reported and weaker on what the value was worth. Here is the grading.
| Claim | Source | Grade |
|---|---|---|
| About S$1bn of economic value in 2025 from 2,000+ models and 430+ use cases | DBS Annual Report 2025, narrative section | Reported by DBS, unaudited |
| S$150m revenue uplift in 2022, restated as S$180m economic value | DBS Annual Report 2022; DBS interview with Jimmy Ng, August 2023 | Reported by DBS; definition changed |
| S$370m in 2023 and S$750m in 2024 | DBS Annual Reports 2023 and 2024 | Reported by DBS, unaudited |
| Value measured by test and control | Nimish Panchmatia, Google Cloud interview, March 2026 | Reported by DBS |
| Only DBS and JPMorgan Chase published total realised AI value | Evident AI Index 2024 | Independent index |
| A board should not quote its own figure without the six demands above | My own read, from governance and assurance work | My call |
Sources
- DBS Group. (2023). Annual Report 2022.
- DBS Group. (2023). DBS’ AI-powered digital transformation.
- DBS Group. (2024). Annual Report 2023.
- DBS Group. (2025). Annual Report 2024: Innovating impactful solutions for customers.
- DBS Group. (2026). Annual Report 2025: Letter from the Chairman and CEO.
- The Edge Singapore. (2026). DBS says AI, data analytics generated about $1 billion in economic value.
- Google Cloud. (2026). How DBS, Singapore’s largest bank, builds AI with confidence.
- Evident. (2024). Here’s the 2024 Evident AI Index.
- Digit.fyi. (2025). AI in banking: Evident AI Index.
Where to start this quarter
Before any AI value figure goes near a board paper, write one page: the components that count, the method for each, and the person who owns each number. Then take the three largest use cases and check whether each has a control group or a recorded baseline. If none does, the first job is to put one in place for the next release, and to report nothing until it has run for a full quarter. The free AI value ledger grades each use case this way and gives you the board figure, with an Excel template for the finance team. The full DBS sequence, and where the value measurement fits in it, is in the case study.

Why Large Enterprises Are Deploying AI at Scale but Measuring It Incorrectly
Why most AI value figures count activity and how to count outcomes instead.

The Four Dashboards Every Chief AI Officer Must Operate
Where a value figure sits among the other numbers a board should see.

How Financial Institutions Should Use AI to Keep Up With Regulatory Change
Another bank use case, and the controls a regulator will expect around it.
If your board is preparing to report AI value for the first time, the one-page definition above is where I usually start. My consulting work covers setting up the measurement and the independent review around it.